How to Use the Cycle Theory in Financial Markets?

8 minutes for reading
Traders are always looking for certain patterns in the market, and attempt to make money from them. Some want complicated trading strategies and price patterns on the charts, while others assess the length and height of price fluctuations. Moreover, one can assess the probability of a decline or growth based on the price cycle theory.
It can be said that cycles account for periods when certain events take place – for example, market trend changes. A cycle of growth changes into a cycle of decline, which is then followed by another growth cycle. There is a view that the trend movement takes 30% of the instrument behaviour on the market, and the remaining 70% is occupied by a side trend.
Quite often, we trade without giving any consideration to the time when our goals will be reached. On the whole, time-based price estimates are not common. However, mind that some authors clench to this theory.
Bill Wolfe, the author of the Wolfe Waves, gives an idea of how to define the time when the goal will be reached. With this theory, an investor knows that they will have to wait several hours or even days, and therefore does not have expectations for a quick profit.
Unfortunately, every author singles out their own cycles and gives them new characteristics. Below, let's try to figure out how to use the various types of cycles in the variants of market analysis. Although everyone might have their own ideas about the types of cycles and their use.
What cycles are there?
Life consists of cycles. John Murphy in his book “Technical Analysis of the Futures Markets” gives examples of cycle studies from as long ago as the 1940s. Cycle studies are applied to the construction sector, stock markets, business, etc.
In trading and investing, we have the following types of cycles:
- Time cycles are for estimating price fluctuations chronologically
- Seasonal cycles, by which we mean noticeable price fluctuations due to weather conditions
- Event cycles, which means that certain events cause certain price movements, and this is repeated behaviour
What do you need cycle studies for?
Firstly, we study cycles in an attempt to predict market behaviour. If the investor has studied price movements in an asset and the factors that influence it, they might try to detect patterns that include noticeable price movements.
Time cycles in the stock market
The time cycle in the stock market refers to the repeating patterns and trends observed in the market over time. These cycles can range from short-term fluctuations to long-term trends, and they play a crucial role in shaping market behavior.
The four phases of a market cycle
A market cycle typically consists of four phases:
Accumulation phase
In this initial phase, smart money and informed investors start accumulating stocks quietly. Prices may still be low, as the broader market may not have caught onto the potential yet. Identifying this phase can help investors spot potential opportunities before the market starts to rally.
Bull market phase
During this phase, the market experiences a sustained upward trend. Optimism prevails, and more investors enter the market, driving prices higher. This is the phase where most investors aim to capitalize on rising prices.
Distribution phase
As the market reaches its peak, the distribution phase sets in. Smart money and early investors start selling their holdings, taking profits from the previous bull market. This can lead to a slowdown in price growth.
Bear market phase
In the bear market phase, stock prices decline as pessimism dominates the market sentiment. Many investors panic and sell, further pushing down prices. However, seasoned investors may see this as an opportunity to accumulate undervalued assets.
Example of the time cycles in the stock market
After the global financial crisis and recession of 2008, analysts expected the same economic crisis to repeat in 2018. They claimed that the time cycle in which a new crisis forms, causing a massive decline in the stock market and resulting in the increase of the price of gold and the USD, lasts 10 years.
However, the evidence of a global crisis showed itself in 2020 only due to serious economic instability and the pandemic of the coronavirus. We can say that there was a time lag but on the whole, the expectations were met.
In 2020, the Dow Jones index dropped from 29,000 points to 18,300 points. On the 2008 chart, the decline was equally massive: the index dropped from 13,700 to 6,600 points.
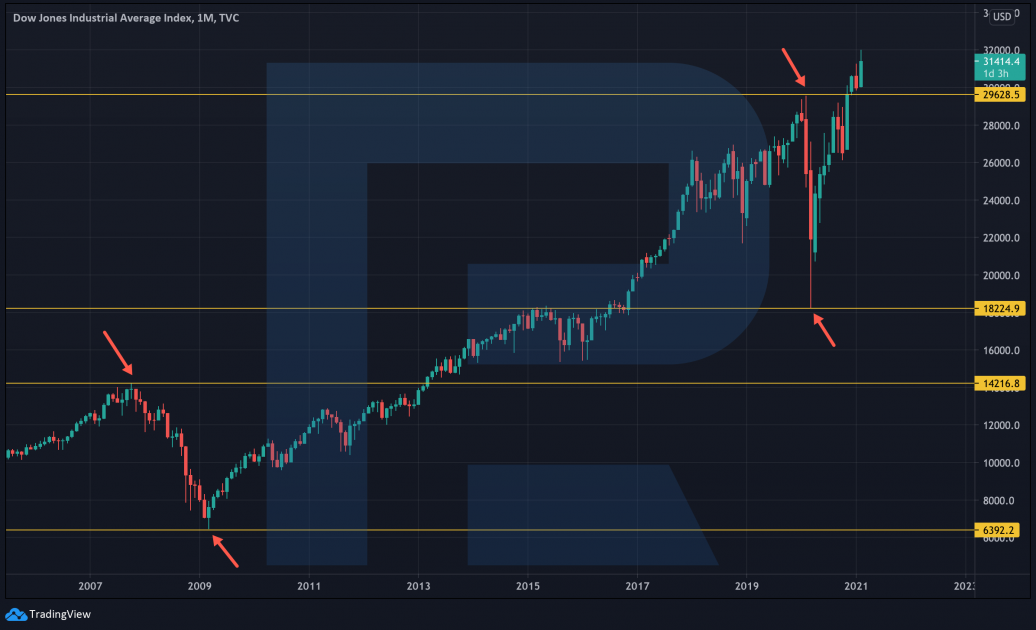
The Dow Jones started growing in March–April 2009, and the same happened from March to April 2020.
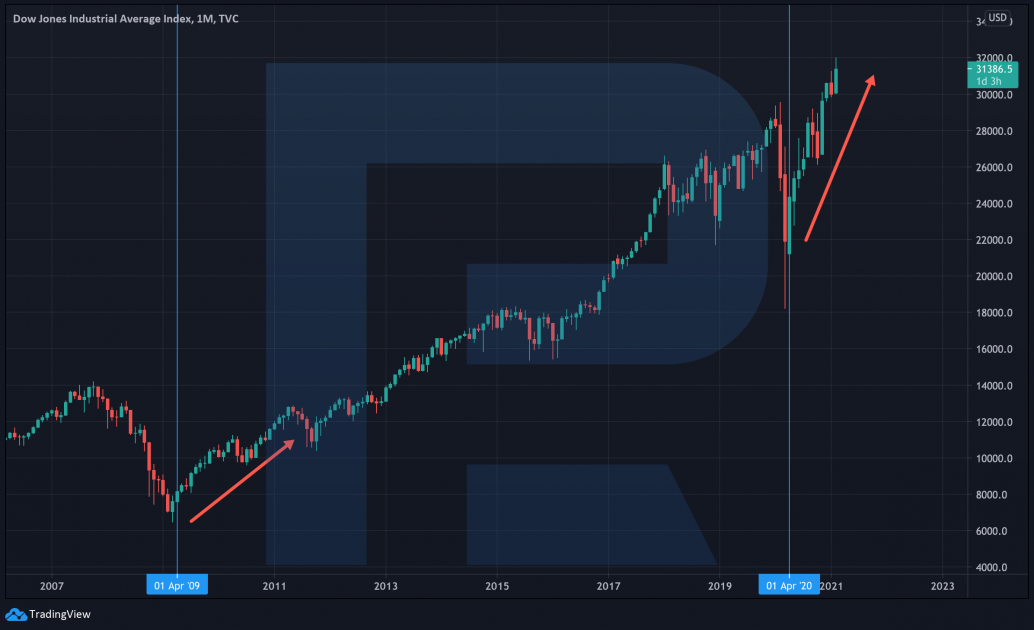
Hence, we can expect another serious decline in the index in 2028–2030, while its growth is just beginning. Clearly, you do not have to rely on these dates only. Track the situation in the market and try to find confirmations of these forecasts. Keep in mind the time lag as well.
Seasonal cycles in oil prices
If we assess the chart of oil prices for the last five years, we can notice a rise in the stock quotes every July. This might be due to bad weather conditions in the Gulf of Mexico: severe hurricanes make oil production drop. Of course, an approaching storm threatens oil production. Hence, the market accounts for such seasonal events and increases oil prices within each cycle.
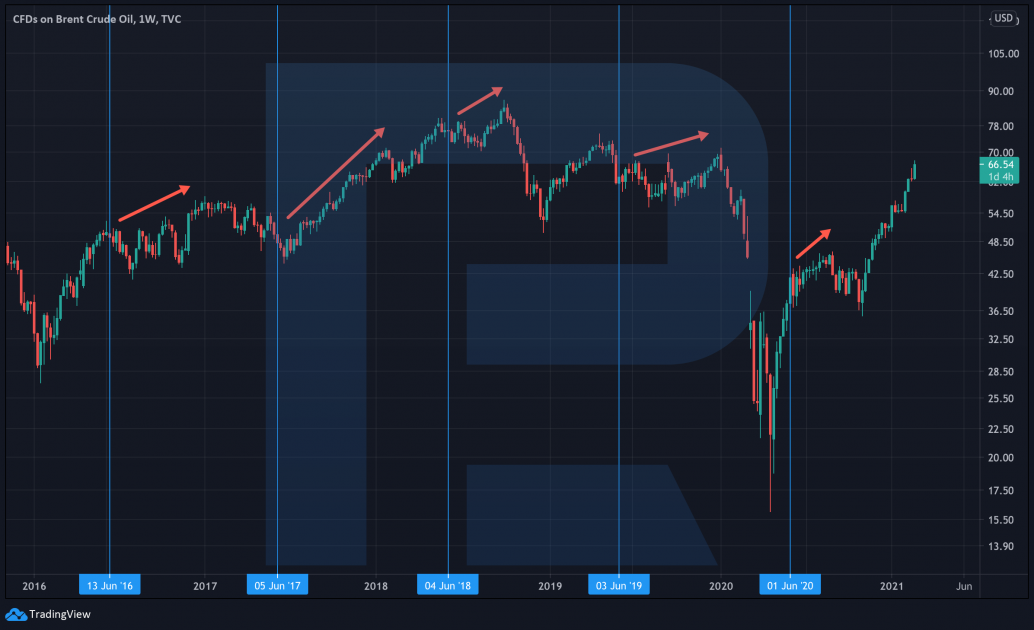
Time cycles also work well in the oil sector. In September 2013, we heard of oil prices peaking, which meant that there was a risk of a decline. However, the decline does not happen at once. It might take years. This was the conclusion made by Jose Antonio Ocampo. He supposed that the whole of the global economy goes in cycles, moving from expansion to contraction and back again. This means that growth alternates with declines strictly time-based, so we should not expect a new decline until 2020. In that year, oil prices demonstrated a historic record drop. However, note that oil prices dropped in 2014 as well.
JPMorgan Chase speaks about a new super-cycle of growth in commodity markets. It states that in the last 100 years, there were only four such cycles, with the most recent one having started in 1996 and ended in 2008. Prices are already rising noticeably, and there is serious potential for increases in 2021 and 2022.
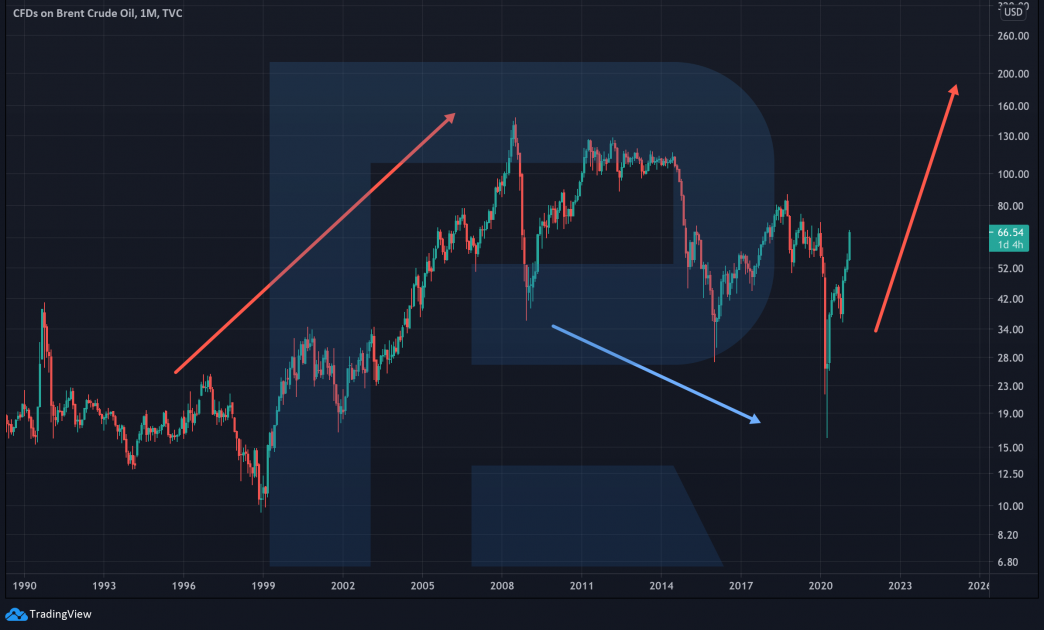
This growth might be attributed to the world economy recuperating after the pandemic, as well as the serious struggle against climate change. The latter factor will cause a serious reduction in oil production and a surge in the oil demand, which is meant to create the infrastructure of renewable energy sources.
Bottom line
Every trader might have their own understanding and use of the cycle theory. More often, investors assess the probability of certain events chronologically.
Prices go in cycles, so events will repeat themselves. You do not even need to look at the chart, provided that you have studied the behaviour of the price and detected periods or events that form new cycles.
Some banks are already talking about new super-cycles of growth in commodity markets, and these stock quotes are going up steadily. And the decline we saw in 2020, was predicted already in 2013.
* - Past performance does not predict future returns.





 are complex instruments and come with a high
  of losing
  rapidly due to
  . 65.68% of retail investor accounts lose
  when trading
  with this provider. You should consider whether you understand how CFDs work and whether you can afford to take the high