How to Use Moving Average for Buying Stocks?

7 minutes for reading
The Moving Average has long been on the trading scene and has become an intrinsic part of many trading strategies. The indicator is simple and works on almost all timeframes and with any instrument.
There are plenty of indicators based on the MA, which are in essence, the same old MA slightly alternated. This is a trend indicator, and its main task is to indicate the direction of the price, smoothing out noises and insignificant fluctuations.
Setting up the indicator
The Moving Average has several settings:
- The Period is the number of bars used for calculations It can be 1 and higher
- The Shift is the number of bars by which the period will be shifted
- Method: there are Simple (SMA), Exponential (EMA), and Weighted (WMA) Moving Averages
- Apply to: close, open, high, or low
By alternating these parameters, a trader can set up the indicator for a certain instrument and trading conditions. There are plenty of ways to use the indicator. MAs with large periods are normally used for medium-term trading. Trading intraday rather requires using MAs with periods below 100.
What it looks like on the chart
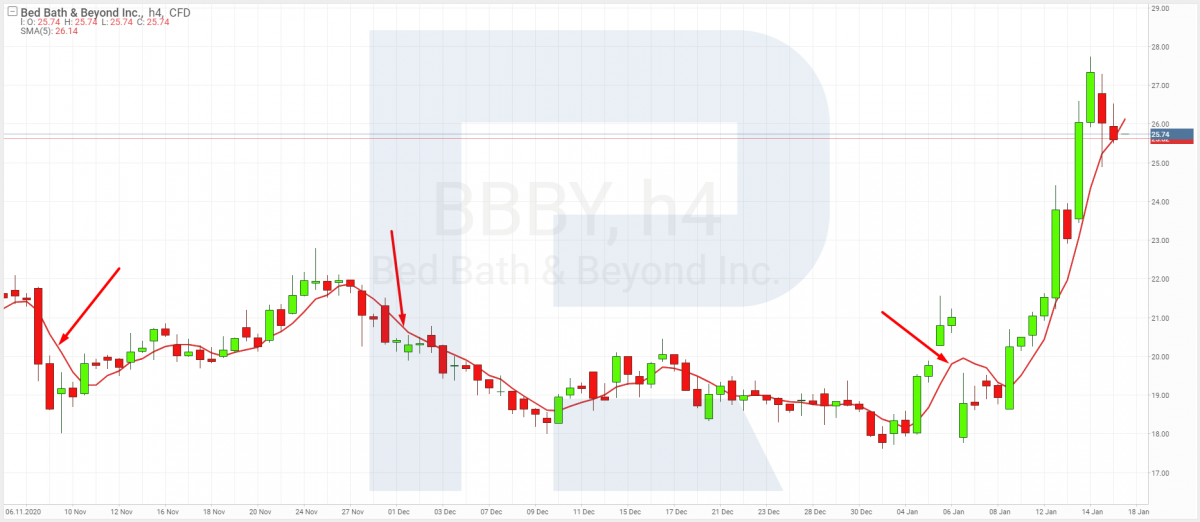
First of all, set the parameters. The smaller the period, the closer the MA will follow the price chart, mimicking the price. In the picture, we see EMA5, which means that the calculation period is 5 last bars, the shift is zero, and apply it to the closing price.
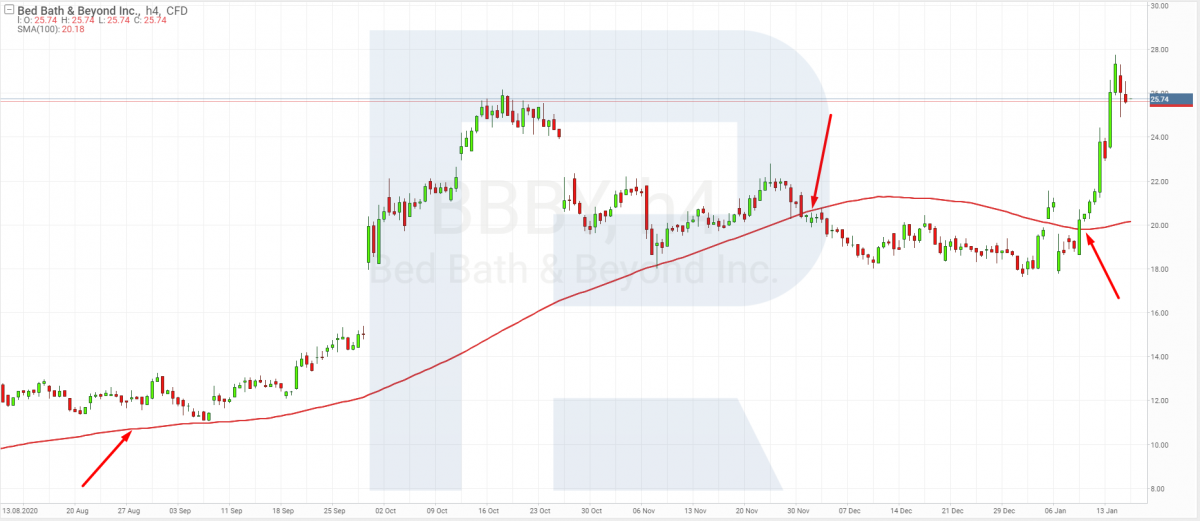
If we choose period 100, the MA will follow the chart closely and sometimes cross it.
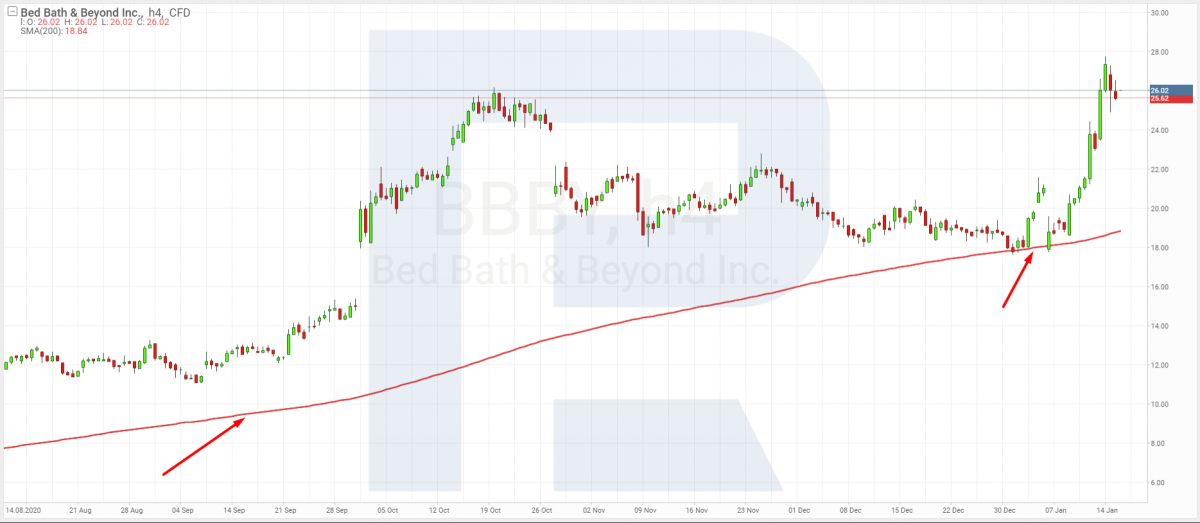
If we use a period above 100, the MA chart will move farther away from the price chart and close it rarer.
Using the MA for trading stocks
Based on the fact that the charts of stocks do not differ much from those of currency pairs, you can use the indicator without significant limitations. Market players say that "bears live under the MA200 while the bulls live above it". This means that, in the long run, the indicator speaks about the continuation of the current trend.
There are several options for trading by the indicator:
- Crossing of MAs
- Bouncing off MAs
- Breakaways of MAs
Crossing of MAs
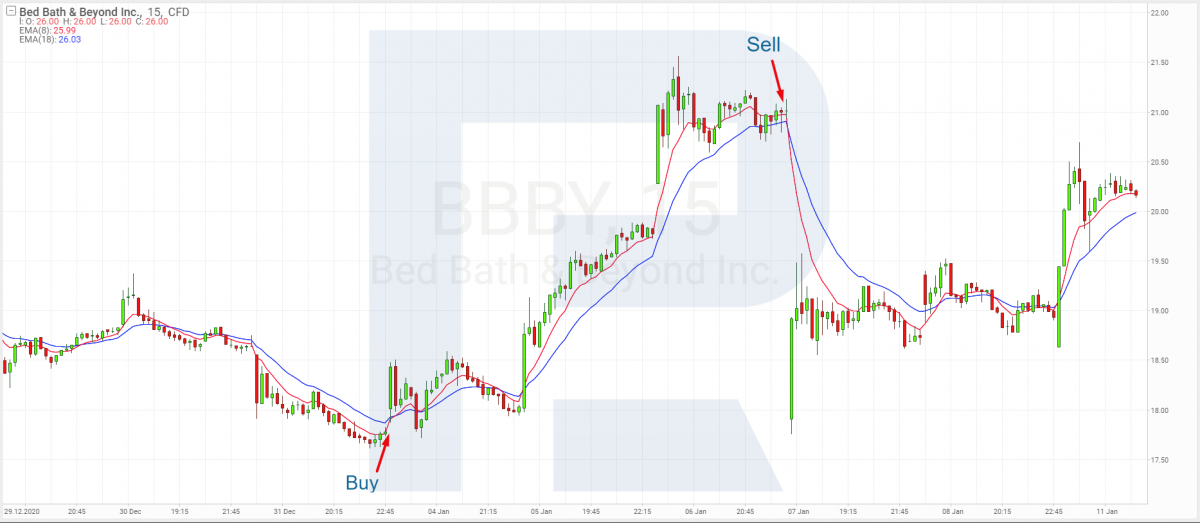
Here, you can trade on any timeframe but mind that charts smaller than M5 will give many false signals. M15 will be optimal for intraday trading.
Strategy instructions
1. Choose stocks with good volatility and trade volume over 500 thousand per session.
2. Draw two MAs on the chart – EMA8 and EMA18 (these are just example settings that can be changed based on the trader's experience), shift: zero, apply to: closing price.
You can also use Fibonacci settings.
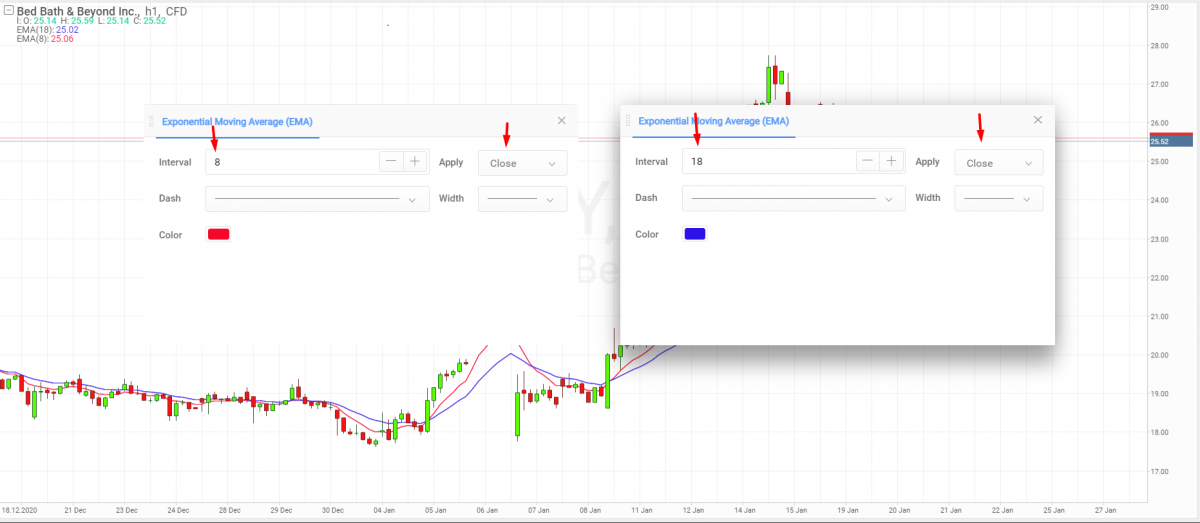
3. As a signal to open a position, you can take the crossing of the two MAs: the fast one with period 8 (red) and the slow one with period 18 (blue).
4. Open a buying position after the fast MA crosses the slow one from below.
5. And vice versa: open a selling position when the fast MA crosses the slow one from above.
The trading strategy that uses several MAs is very widespread and has several setting options. In such cases, a Stop Loss is placed behind the nearest high or low. Close the positions when the MAs cross vice versa.
Bouncing off the MA
For this trading option, we only use one MA with a period over 50 (it can be smaller but there will be many false signals). Choose potential stocks for trading the same way as above.
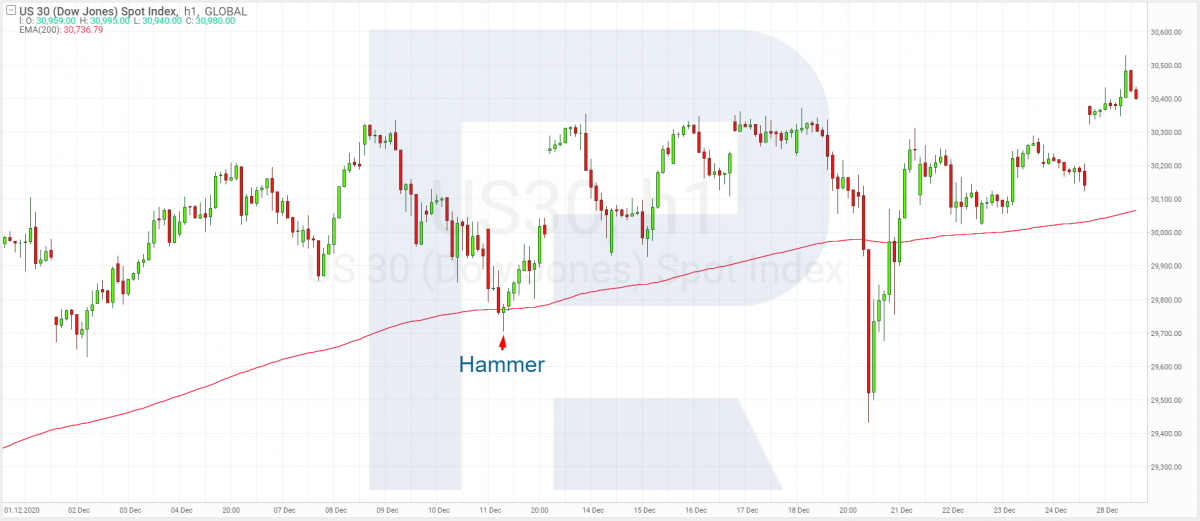
Add an EMA200 to the chart; shift zero, apply it to the closing price, the colour at our discretion. As an additional opening signal, use reversal candlestick patterns from classic tech analysis: a Hammer, Inverted Hammer, Shooting Star, Hanging Man, Doji, Engulfing, or Harami.
Open a position when a reversal pattern forms at the place where the chart touches the MA. In such a case, the indicator line becomes the support/resistance level.
An example of opening a buying position: after growth, the quotations form a pullback to the support level, which is the EMA200; and upon reaching it, they form a reversal pattern Hammer. After the candlestick closes, open a buying position. Place an SL behind the low of the Hammer and a TP behind the nearest high.
A selling position is opened in the same way with the only difference being that the price pulls back after a decline to the MA below. Mind that you trade the overall trend.
Breakaways of MAs
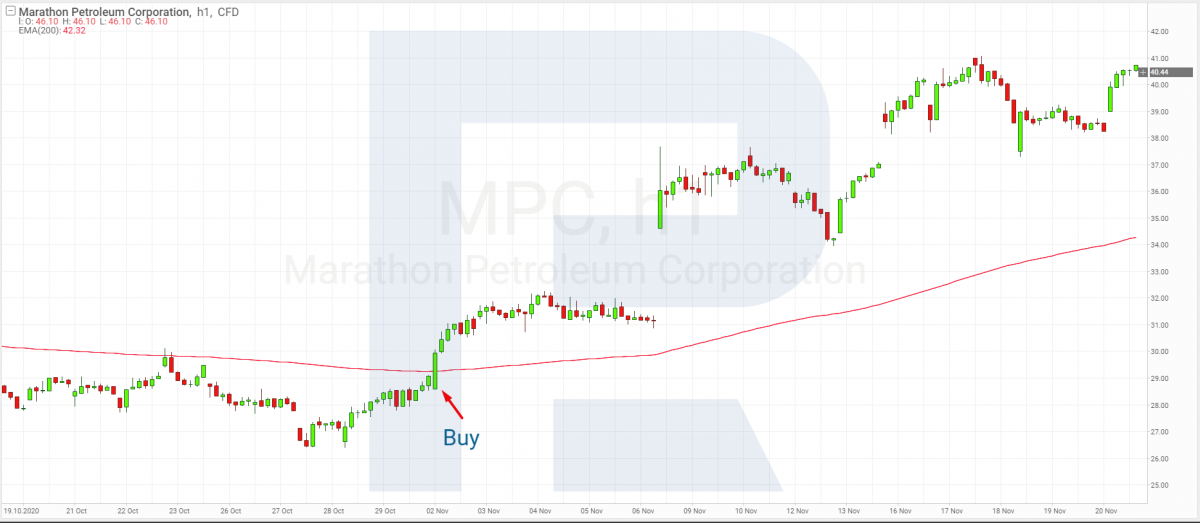
The principles by which you trade breakaways of MAs are the same as for trading breakaways of technical support/resistance lines. In this case, the MA acts as one of these levels. As long as the overall trend can change, you can open positions against it.
An example of opening a buying position: the quotations spent some time under the EMA200 and approached it from below again, breaking it away by one candlestick. After this one closed, the next candlestick opened above the closing price of the previous candlestick, which can be interpreted as a signal to buy.
Place the SL at the nearest low. As you see on the chart, the price reversed and started forming an uptrend. Close the position after the MA is broken away by the price in the opposite direction.
Advantages and drawbacks of MAs
The advantages are:
- A whole range of settings
- Applicable to all instruments
- Can be combined with other indicators
- Several MAs constitute a whole trading strategy
The drawbacks are:
- Many false signals on M1 and M5
- Lagging
- Incorrect data in flats
- Makes errors in the case of gaps
Conclusion
The Moving Average has long been a popular instrument. New indicators keep being developed based on it. Using the MA with other trend instruments can increase your chances for success in trading stocks and indices in the stock market.
*Past performance does not predict future returns.


 are complex instruments and come with a high
  of losing
  rapidly due to
  . 65.68% of retail investor accounts lose
  when trading
  with this provider. You should consider whether you understand how CFDs work and whether you can afford to take the high