Long-Term Investments: How to Choose Stocks?

11 minutes for reading
Any trader who has decided to quit intraday trading is facing the questions: what criteria to use for selecting stocks for long-term investment, and what is worth paying attention to first and foremost? In this case, the trader should start with the simplest method: searching the internet to find the ratios, which are available to any investor who is not particularly eager to go into details.
Here is an example of a company overview from a website.

What we see here is the main information about the company: the income of the issuer, the earnings per share (year-on-year), and the dividend yield. Before going into long-term investing, it is crucial to decide on the type of income you intend to earn from your investments; which can be divided into three groups:
Dividend yield
The easiest type of analysis is done by conducting a search for stocks with a good dividend yield. There is no need to dig deep into the financial details of companies when researching dividend data, as this information is usually described in the company overview. With the available data on previous dividend payments, investors can calculate possible profits and select a company that meets their satisfaction. There is always a risk that the shares of the chosen issuer will drop in price. Nevertheless, in the case of long-term investment, companies that pay out good dividends are financially stable. In the worst case, their stocks would trade in a range, or the price of their shares would fall along with the decline of stock indices when all stocks trading on the market drop in price. By using such tactics, if the stocks increase in price, you will receive a surplus of the sum of your investments as additional income several times.
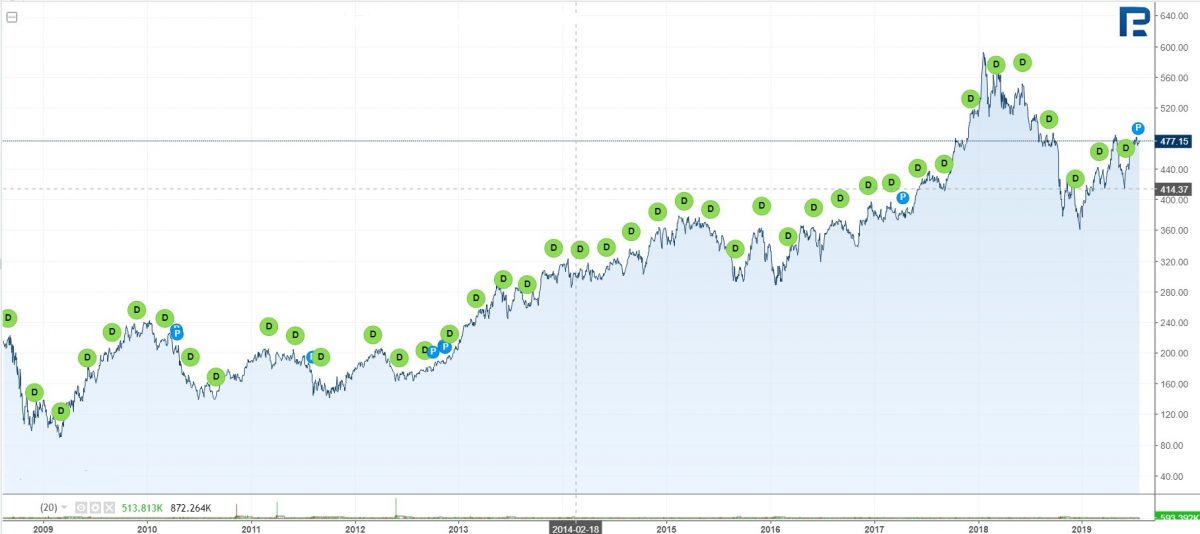
For example, the world's biggest investment company, BlackRock Inc (NYSE: BLK) (to December 2020), managing more than 6.5 trillion USD, is currently paying a 12.02 USD dividend per stock, which is 2.5% Y/Y. The return is not very large, but the company pays out dividends regularly, and during the last 10 years its stock price has increased 10 times.

You can also choose several strategies with dividends. For example, in your investment portfolio, you can include companies that spend the most money on paying out dividends. Dividend payments decrease the company's market capitalisation, and these funds are not used for the further development of the issuer. Therefore, it can be said that only financially stable companies can afford to pay out high dividends, which also means there is a good chance that their stocks might grow in price. Below is an example of companies spending the most money on dividends (to December 2020):
| Price per stock, USD | Dividends paid yearly, billion USD | Return on stocks for 10 years, % | |
|---|---|---|---|
| Royal Dutch Shell (NYSE: RDS.A) | 63.50 | 15.675 | 13 |
| Microsoft Corp. (NASDAQ: MSFT) | 140.00 | 13.81 | 700 |
| Exxon Mobil (NYSE:XOM) | 140.00 | 13.81 | 700 |
| Apple Inc. (NASDAQ: AAPL) | 208.00 | 13.71 | 600 |
| AT&T Inc. (NYSE: T) | 33.00 | 13.41 | 22 |
As you can see, none of these stocks has shown negative profitability during the previous 10 years, while some demonstrated more than 100% profitability. This information suggests that you should not rely solely on one company as this enhances the possibility of making the wrong choice. What's more, force majeure, which could deteriorate a company's business, should also be taken into consideration. For this reason, your portfolio should consist of different securities from different sectors of the economy.
The second method is to select a company with a high dividend yield. However, this approach is riskier as there is a chance of buying the stock of a company that might go bankrupt in the future. To avoid this risk, you should research how long the company has been paying dividends, how often it pays them, study the payment dynamics, and how the stock reacts to the said payments.
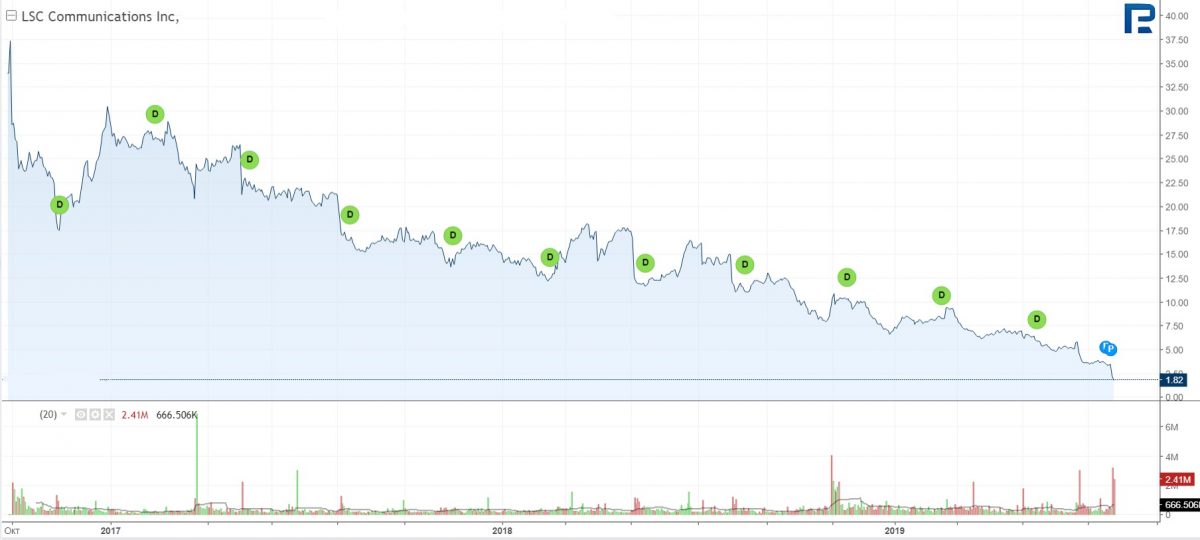
For example, there is an issuer with a dividend yield of more than 85%, but the stock price has been declining for the last 3 years, and the company is working with constant loss. In such a case, we can conclude that the stockholders have been taking the biggest part of the company's profit in the past, preventing the company from investing in its development.

This is why very high dividends might deteriorate the long-term work of the issuer, in which case, the dividend yield will not cover the losses entailed by the stock decline.
Let's go more modest by considering a lower dividend yield and the net profit of the issuer. For example, in 2020, the well-known Ford Motor Company (NYSE: F) paid out 3 billion USD in dividends with a profitability of 5.9% Y/Y. Nevertheless, after all the payments, the company still had more than 1 billion USD in net profit, which it could spend on its further development. What's more, its stock is now trading at its 10-year minimum, which makes it attractive to investors. All in all, when in search of suitable stock for a long-term portfolio, the large dividend payouts (in comparison with the company's rivals) and the presence of net profit might be a more reliable source of information than just the factor of high profitability.
Undervalued companies
Another effective method is conducting research to identify companies that are undervalued by investors, especially in times of a growing market. There are certain criteria for defining that the issuer's stock is undervalued. Unfortunately, just because market players have paid attention to a certain stock and have purchased it, does not necessarily mean that its price is going to increase, otherwise, the lack of demand will lead to a decline in the price.
On the one hand, the market is very simple: if there is increased demand, the stock rises; and if there is increased supply, the stock falls. If you have identified a company whose stock price, in your opinion, should be much higher, this does not necessarily mean that its price will increase - not until other investors share your opinion. While there are recommendations of analysts, publications of rating agencies, forecasts of management companies — all of which are aimed at attracting investor attention to the stock they consider as undervalued - at the same time, the definitions of the undervalued state may differ. The development of new technologies has facilitated the search for such stocks. If you have identified some undervalued stocks, you can make use of the many algorithms available in the market nowadays for calculating company coefficients.
Let's have a look at a simple example of searching for such stock by way of a comparative analysis of competing companies.
| Nvidia | Advanced Micro Devices | Micron | |
|---|---|---|---|
| Price of stock, USD | 162 | 31 | 40 |
| Capitalization, billion USD | 98.51 | 34.15 | 43.75 |
| Stocks on the market, million USD | 608 | 1101 | 1093 |
| Net profit, million USD | 394 | 16 | 840 |
| Income, billion USD | 2.2 | 1.27 | 4.78 |
| EBITDA | 0.44 | 0.09 | 2.38 |
| Operational income, billion USD | 0.358 | 0.038 | 1.01 |
| Available cash, billion USD | 7.8 | 1.19 | 6.68 |
| Aggregate assets, billion USD | 14.02 | 4.31 | 46.28 |
| P/E | 30.77 | 124.76 | 5.08 |
| Short Float, % | 2.16 | 10.38 | 3.44 |
The analysis was carried out on 9 July 2020. Since then, Micron's stock price has increased 20% to December 2020, The final index that defined the company as undervalued was the P/E coefficient, the lowest in the present situation. At the same time, the net profit and the income were the highest. Finally, the Short Float index demonstrated a small number of those eager to make a profit on the decline of the stock price.
Here, a thought might emerge that if the P/E coefficient can help find undervalued stocks, it might equally help identify those trading very high. Well, this principle should work in theory, but in practice, it doesn't.
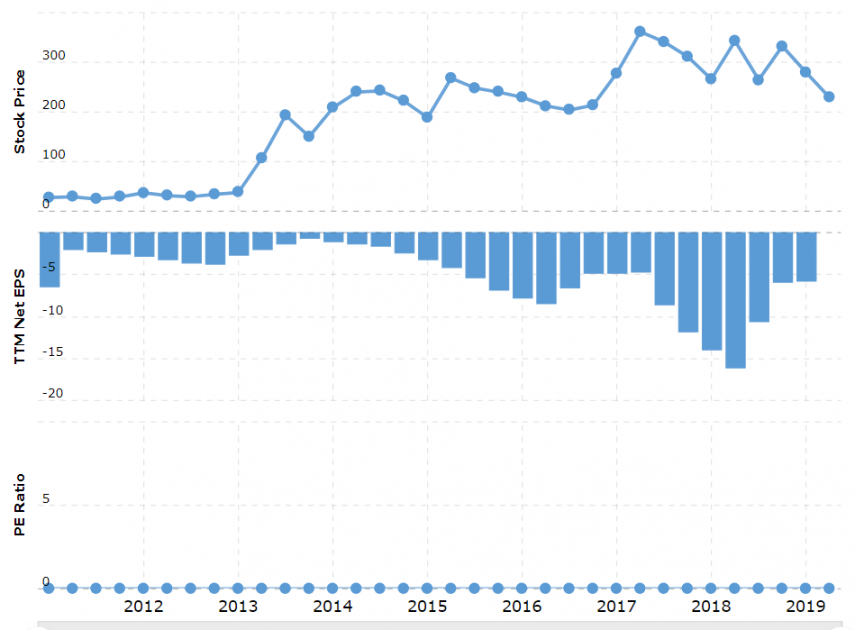
There are promising companies that have just started their development, attracting lots of money at the beginning to increase production or invest in their new research. For this reason, the P/E will be almost zero, while their stocks might cost 200-300 USD. A simple example: in December 2020, Tesla, Inc. (NASDAQ: TSLA) had a P/E of 0, but its stock cost 220 USD, while the Short Float was over 31%, which was a very high percentage for the short positions in the stock.

Before December 2020, Tesla always had a 0 P/E, which did not prevent its stock from growing from 27 to 360 USD. This made short-sellers who paid attention to the company's debts open short positions and finally lose some 5 billion USD. They had missed the fact that Tesla worked with new technologies that were unavailable to other electric car manufacturers and that it was, in essence, a very promising company that managed to deliver on higher-than-anticipated demand.
This is why the third approach to good investing is to receive income from stocks of promising companies.
Companies with high growth potential
The most promising issuers are young companies that have just started establishing themselves in the market. Recently, these are most frequent in the technology and biotechnology sectors. Their stocks are considered promising because their position depends on the invention of some medicine for an illness that's very difficult to cure, which may immediately transform the company from a losing one into a profitable and promising company.
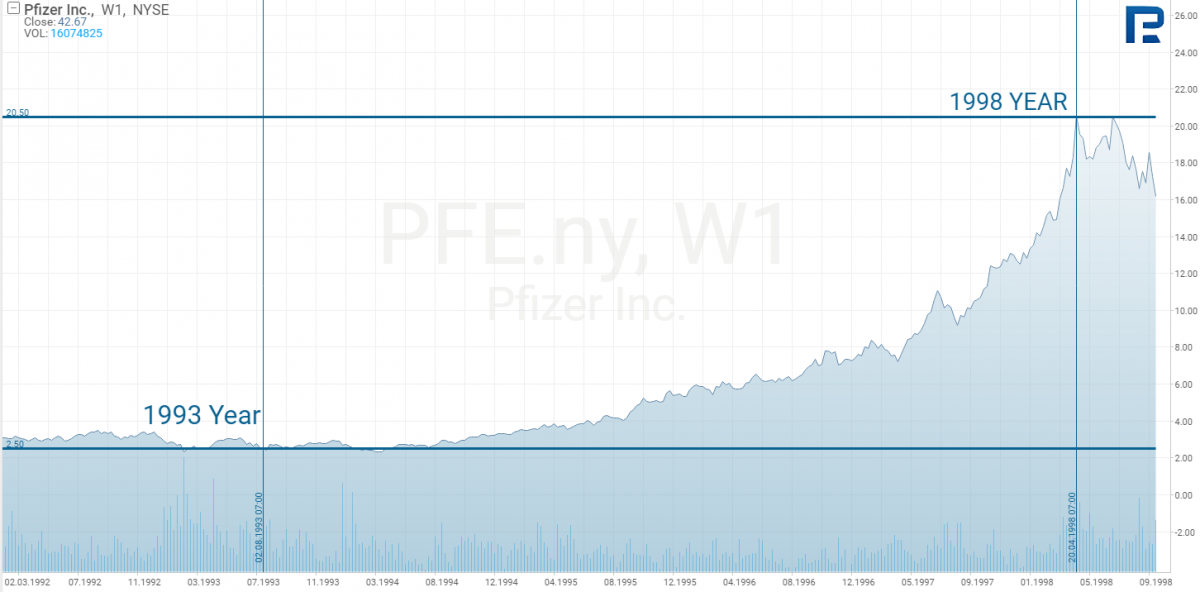
A bright example here would be Pfizer Inc. (NYSE: PFE), the producer of Viagra. Clinical research of Viagra began in 1993, and it appeared for sale in 1998. However, the information about the research and the purpose of the medicine became known before Viagra entered the market. Pfizer had managed to make a name for itself, becoming an industry giant, even before the launch of Viagra, which made its stock skyrocket more than 900%. However, when Viagra was eventually available for purchase, this remarkable growth came to an end. This is a great example of the principle "buy on rumours, sell on facts".

Summary
There is no method that works 100% to let you know if a company's stock is worth investing in because the stock price is influenced by several factors, the least predictable of which is the human one: some people will invest in a company they consider promising, while others will simply be their followers, buying the stock of this same company only because the others did before them, even if their choice might be wrong.
Similarly, on the stock market, some stocks skyrocket even if they seemed to have no real value, while profitable companies can be seen as not attractive enough to invest in. This is why you should have a defined, clear goal when it comes to long-term investment. Then you can choose one of the options from this article to select the potential securities for purchase.
* – Past performance is not a reliable indicator of future results or future performance.
The material presented and the information contained herein is for information purposes only and in no way should be considered as the provision of investment advice for the purposes of Investment Firms Law 87(I)/2017 of the Republic of Cyprus or any other form of personal advice or recommendation, which relates to certain types of transactions with certain types of financial instruments.


 are complex instruments and come with a high
  of losing
  rapidly due to
  . 65.68% of retail investor accounts lose
  when trading
  with this provider. You should consider whether you understand how CFDs work and whether you can afford to take the high