Top 5 Stocks in May: Leaders in Growth and Decline
10 minutes for reading
Upstart Holdings Inc., Palantir Technologies Inc., Carvana Co., Equitrans Midstream Corp., and Credo Technology Group Holding Ltd. were among the top five growth stocks in May. Meanwhile, Icahn Enterprises L.P., Advance Auto Parts Inc., Foot Locker Inc., iQIYI Inc., and Bilibili Inc. were the five companies that faced notable declines last month.
Selection criteria for companies:
- The stock is traded on the NYSE and NASDAQ
- The share price exceeds 2 USD
- The companies are not classified as funds
- Their market capitalisation is over 2 billion USD
- The average trading volume for the last 30 days is more than 750,000 shares
Growth and decline values were determined as the percentage difference between the opening prices on 1 May and the closing prices on 31 May 2023. The market capitalisation of the companies was valid as of the time of writing.
Stocks with the most significant gains in May
1. Upstart Holdings: +96.82%
Founded in: 2012
Registered in: the US
Headquarters: San Mateo, California
Sector: financial services
Platform: NASDAQ
Market capitalisation: $2.46 billion
Upstart Holdings Inc. operates a cloud-based lending platform that utilises AI technology. Sophisticated machine learning models are used to enhance the accuracy of credit risk assessment and increase the number of credit approvals. The primary partners of the company are banks and credit unions.
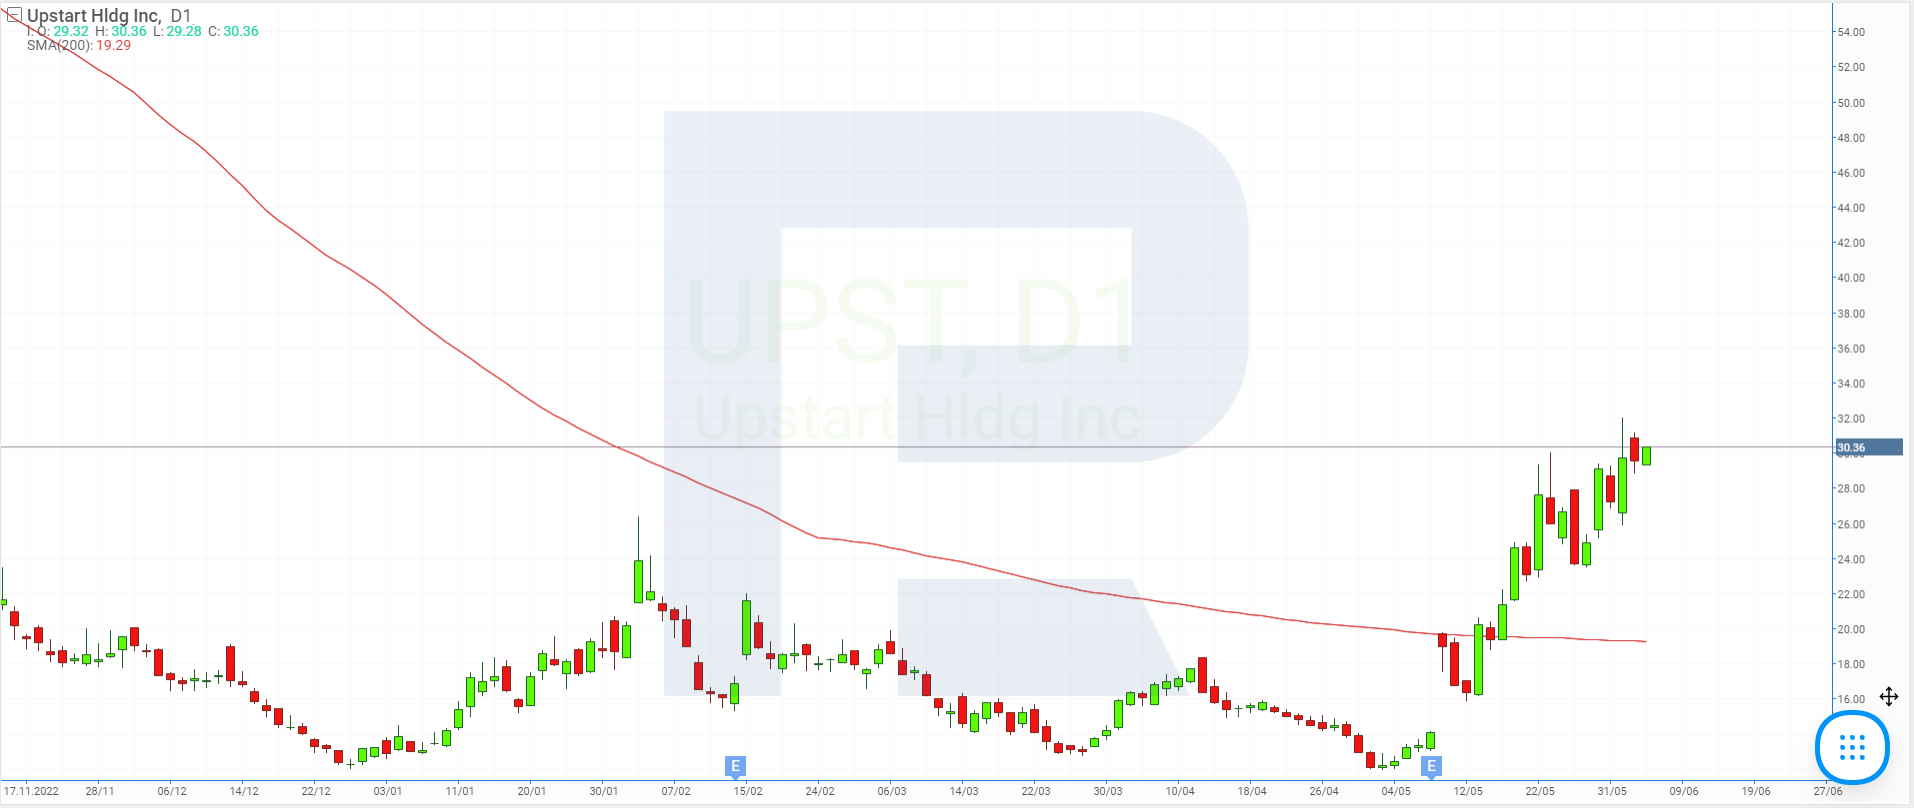
Upstart Holdings Inc. (NASDAQ: UPST) stock skyrocketed 96.82% in May, rising from 13.84 USD to 27.24 USD per share. The corporation released its Q1 2023 results on 9 May, reporting a 66.81% decline in revenue to 102.93 million USD compared to the statistics for the corresponding period in 2022. Net loss reached 129.25 million USD or 1.58 USD per share, while a profit of 32.69 million USD or 0.34 USD per share was recorded a year ago.
Meanwhile, Upstart Holdings Inc. expects Q2 2023 revenue to reach 135 million USD and net loss to decrease to 40 million USD. In addition, it was announced that the corporation had entered into new partnership agreements to secure 2 billion USD in funding over the next 12 months.
On 15 May, it was reported that Upstart Holdings Inc. agreed to sell consumer instalment loans amounting to 4 billion USD to investment company Castlelake L.P.
2. Palantir Technologies: +89.81%
Founded in: 2003
Registered in: the US
Headquarters: Denver, Colorado
Sector: technology
Platform: NYSE
Market capitalisation: 30.79 billion USD
Palantir Technologies Inc. develops and commercialises software for data collection and analysis, incorporating artificial intelligence in its products. Its main clients are intelligence agencies, investment banks, and hedge funds.
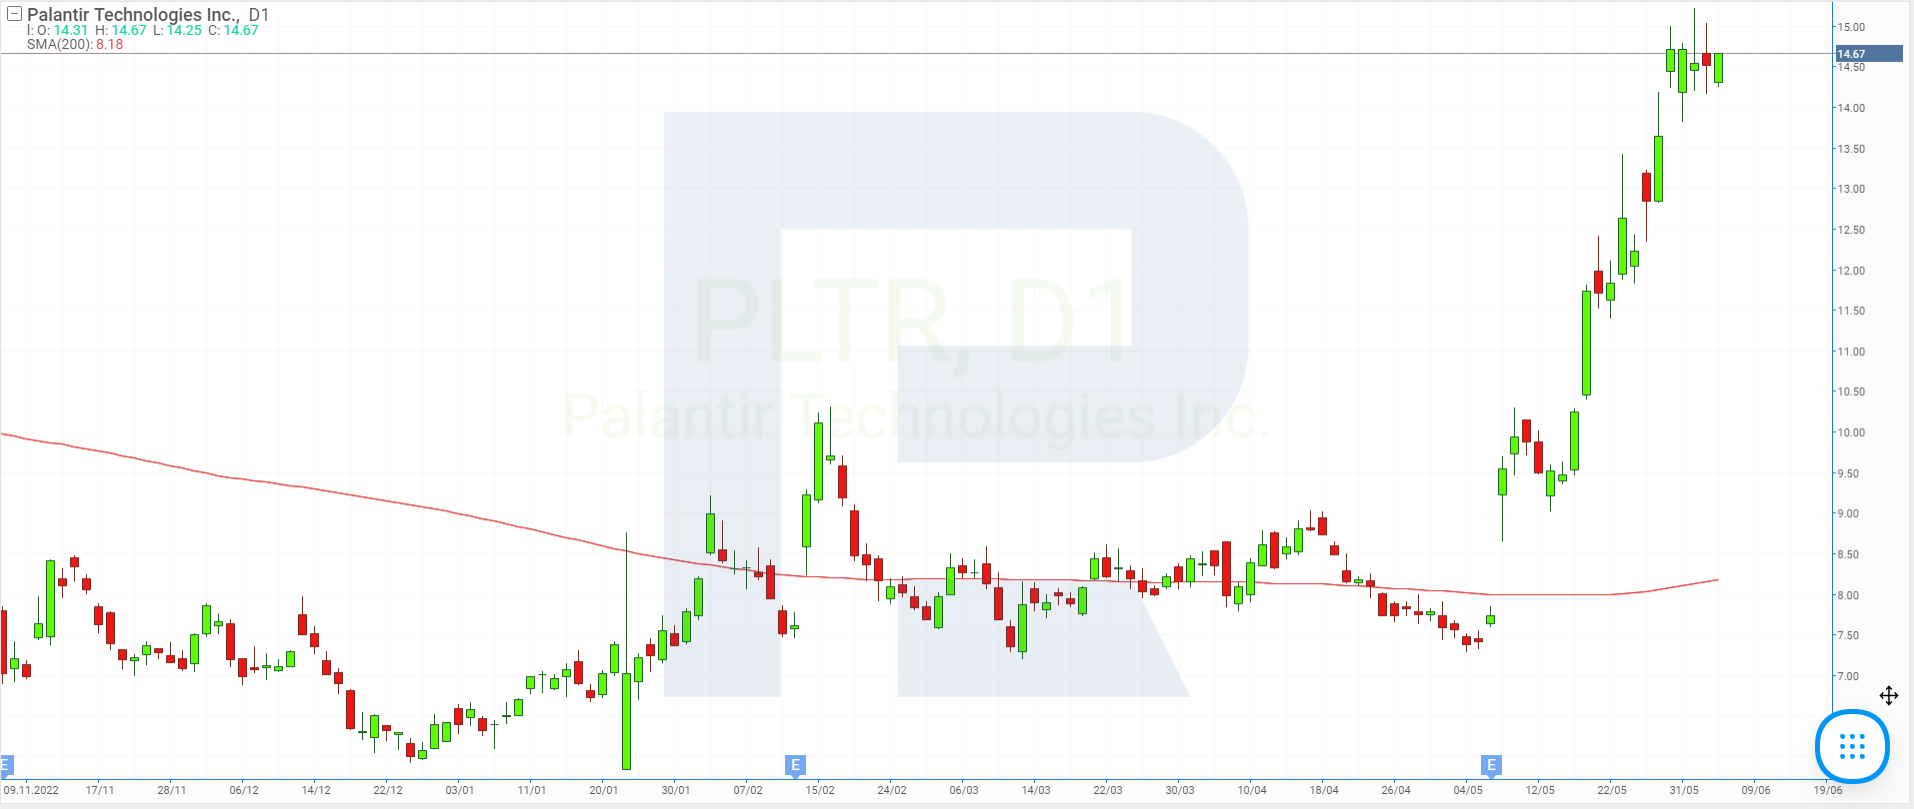
Palantir Technologies Inc. (NYSE: PLTR) shares surged 89.81% in May, rising from 7.75 USD to 14.71 USD. On 8 May, the corporation released its Q1 2023 report. Revenue increased by 18% to 525.19 million USD, and net profit amounted to 17 million USD or 0.01 USD per share. It is worth noting that the company has recorded a profit for the second consecutive quarter.
Palantir Technologies Inc. management forecasts that revenue in Q2 this year will be around 528-532 million USD, with the full-year indicator reaching 2.19-2.24 billion USD. The company expects to demonstrate net profit throughout all quarters of the current year.
3. Carvana: +77.23%
Founded in: 2012
Registered in: the US
Headquarters: Tempe, Arizona
Sector: consumer cyclical
Platform: NYSE
Market capitalisation: 2.99 billion
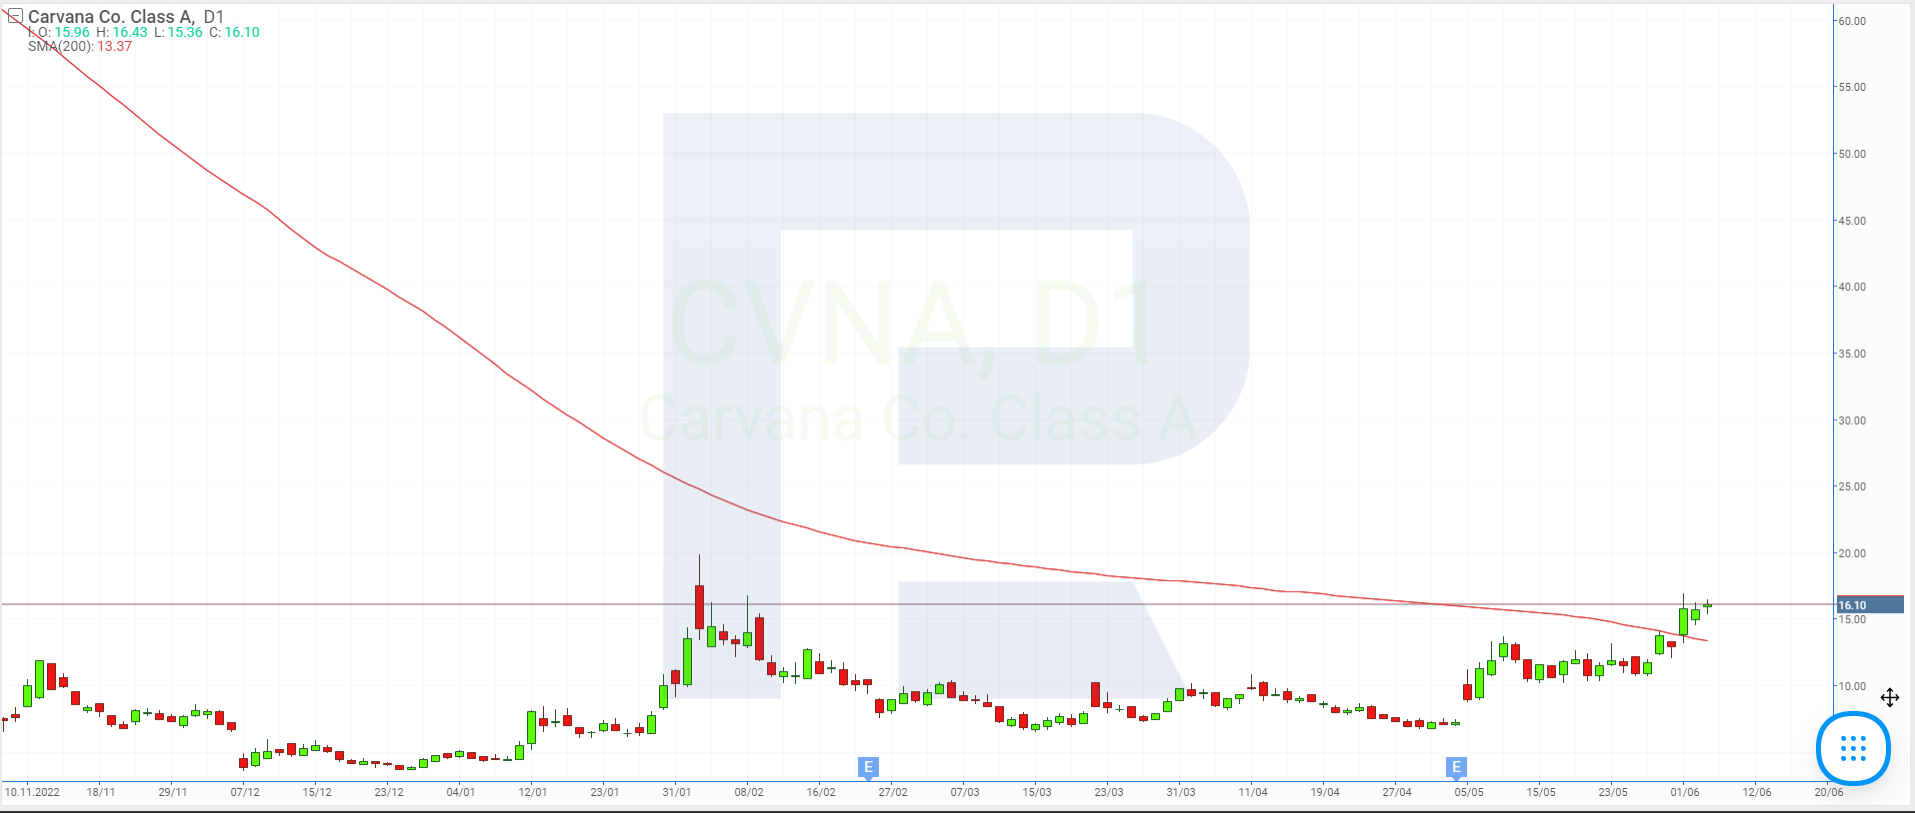
Carvana Co. owns an online platform for buying and selling used cars in the US. Carvana Co. (NYSE: CVNA) stock increased 77.23%, rising from 7.29 to 12.92 USD per share at the end of last month. One of the main factors for this surge can be the Q1 2023 statistics, which were published on 4 May.
Carvana Co.’s revenue for January to March declined 25.48% to 2.61 billion USD, while the net loss decreased by 43.48% to 286 million USD. The report showed investors that the company’s management can control costs and considerably reduce the risk of bankruptcy. The company was facing this due to the rise in interest rates and the decline in prices of used cars, as well as the ill-timed purchase of the ADESA auction business.
4. Equitrans Midstream: +66.93%
Founded in: 2018
Registered in: the US
Headquarters: Canonsburg, Pennsylvania
Sector: energy
Platform: NYSE
Market capitalisation: 3.38 billion USD
Equitrans Midstream Corp. specialises in the gathering, pipeline transportation, and storage of natural gas, as well as providing water supply services to production project sites. Its operations are primarily concentrated in south-western Pennsylvania, northern West Virginia, and south-eastern Ohio.
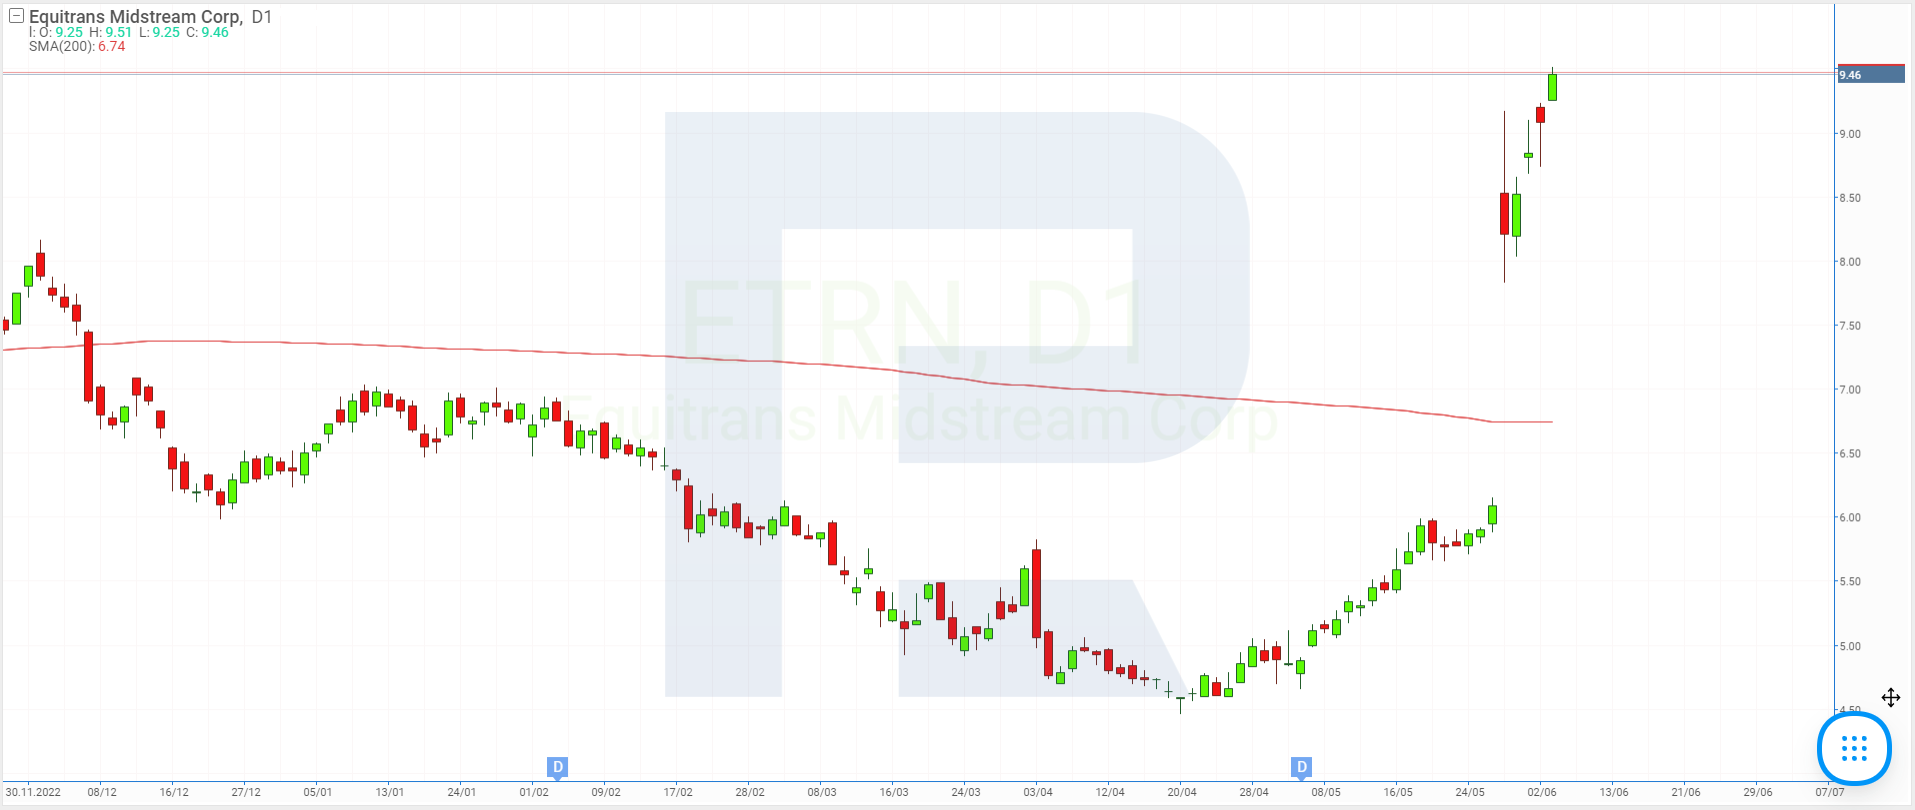
Equitrans Midstream Corp. (NYSE: ETRN) share value increased by 66.93% in May, rising from 5.11 USD to 8.53 USD per unit. On 30 May, the US House of Representatives passed a bill to raise the national debt ceiling. On that very day, the corporation’s quotes leaped up by 34.81%.
The document contains provisions approving permits to resume the construction of the Mountain Valley gas pipeline. Equitrans Midstream Corp. is involved in this project, and the construction of the pipeline is likely to have a positive impact on the company’s productivity and earnings.
5. Credo Technology Group Holding: +65.27%
Founded in: 2008
Registered in: the US
Headquarters: San Jose, California
Sector: technology
Platform: NASDAQ
Market capitalisation: 2.46 billion USD
Credo Technology Group Holding Ltd. develops and sells innovative, secure, high-speed, and energy-efficient solutions for wired connections, enabling data transmission. The company is actively expanding not only in the US but also in the Asian markets.
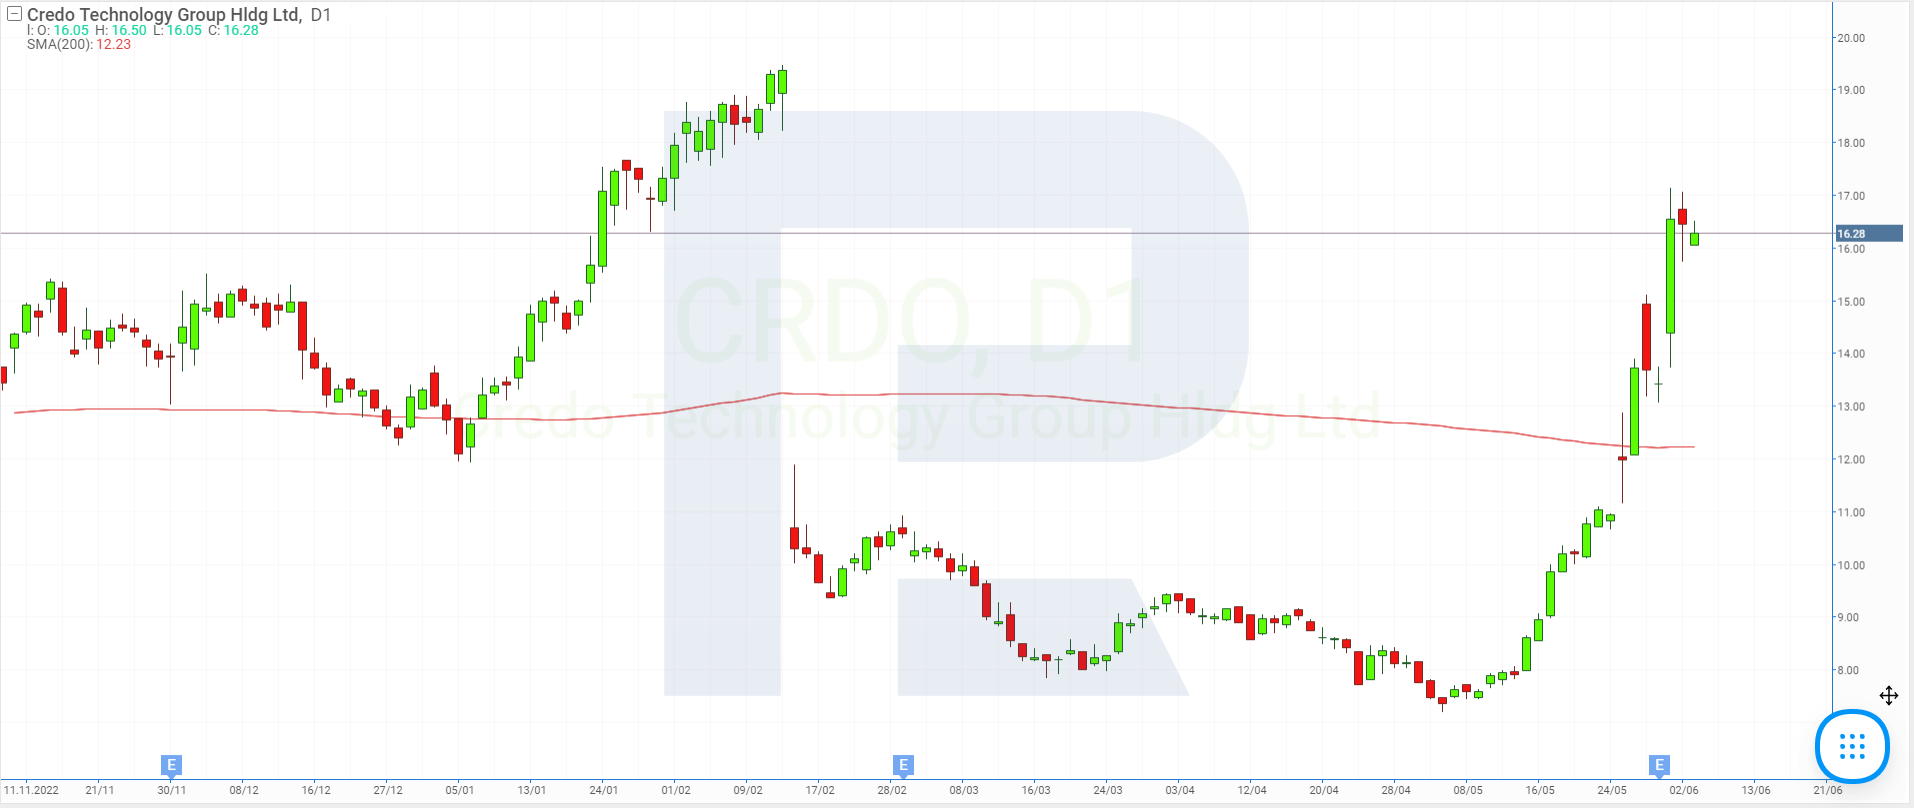
Credo Technology Group Holding Ltd. (NASDAQ: CRDO) stock saw a 65.27% increase during the last month, rising from 8.12 USD to 13.42 USD. On 31 May, the holding reported its fourth-quarter and full-year 2023 results. The annual revenue of Credo Technology Group Holding Ltd. was up by 72.99%, increasing to 184.19 million US, while the net loss declined by 25.38% to 16.55 million USD or 0.11 USD per share.
Stocks with noteworthy declines in May
1. Icahn Enterprises: −55.75%
Founded in: 1987
Registered in: the US
Headquarters: Sunny Isles Beach, Florida
Sector: energy
Platform: NASDAQ
Market capitalisation: 8.05 billion USD
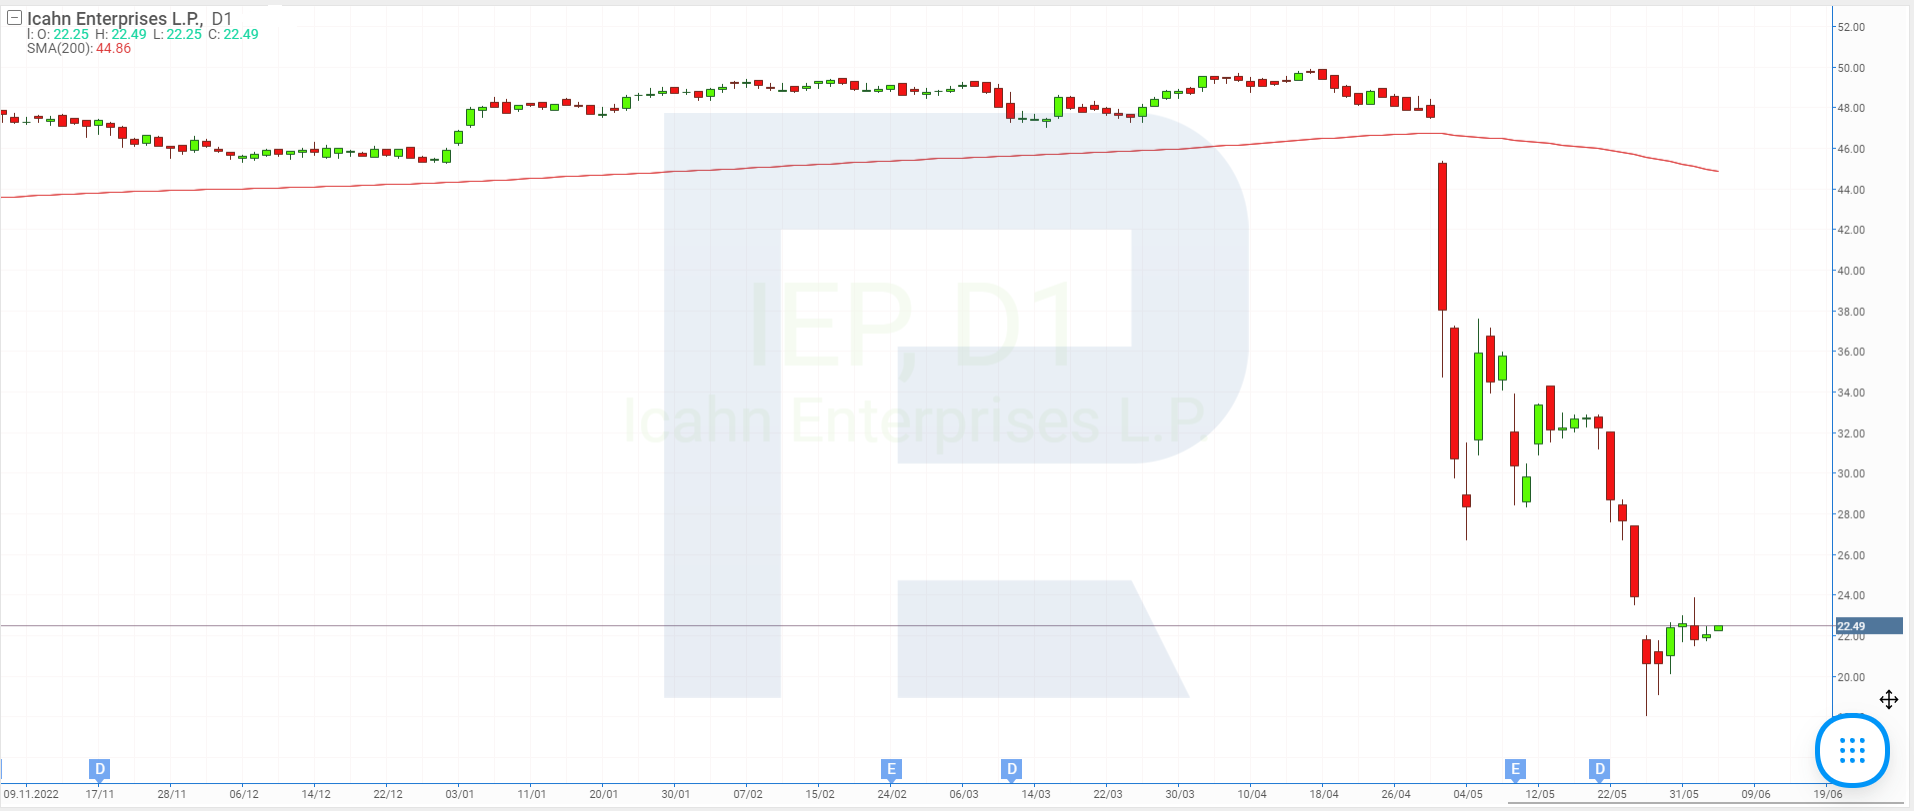
Icahn Enterprises L.P. operates in the investment, energy, automotive, food packaging, real estate, consumer goods, and pharmaceutical industries. Icahn Enterprises L.P. (NASDAQ: IEP) shares tumbled 55.75% in May, falling from 51 USD to 22.57 USD per unit.
On 2 May, Hindenburg Research published a report, in which it claimed Icahn Enterprises L.P. to be considerably overvalued and accused the company of inflating the value of its portfolio and using a Ponzi scheme to fund its dividends.
It was revealed that the US Attorney’s Office for the Southern District of New York has taken interest in the Hindenburg Research report and requested Icahn Enterprises L.P. to provide detailed information on corporate governance and dividends.
2. Advance Auto Parts: −41.96%
Founded in: 1929
Registered in: the US
Headquarters: Raleigh, North Carolina
Sector: consumer cyclical
Platform: NYSE
Market capitalisation: 4.04 billion USD
Advance Auto Parts Inc. sells spare parts, accessories, tools, batteries, and other automotive products for passenger and cargo transport vehicles. The company owns brands such as Advance Auto Parts, Autopart International, Carquest, and Worldpac.
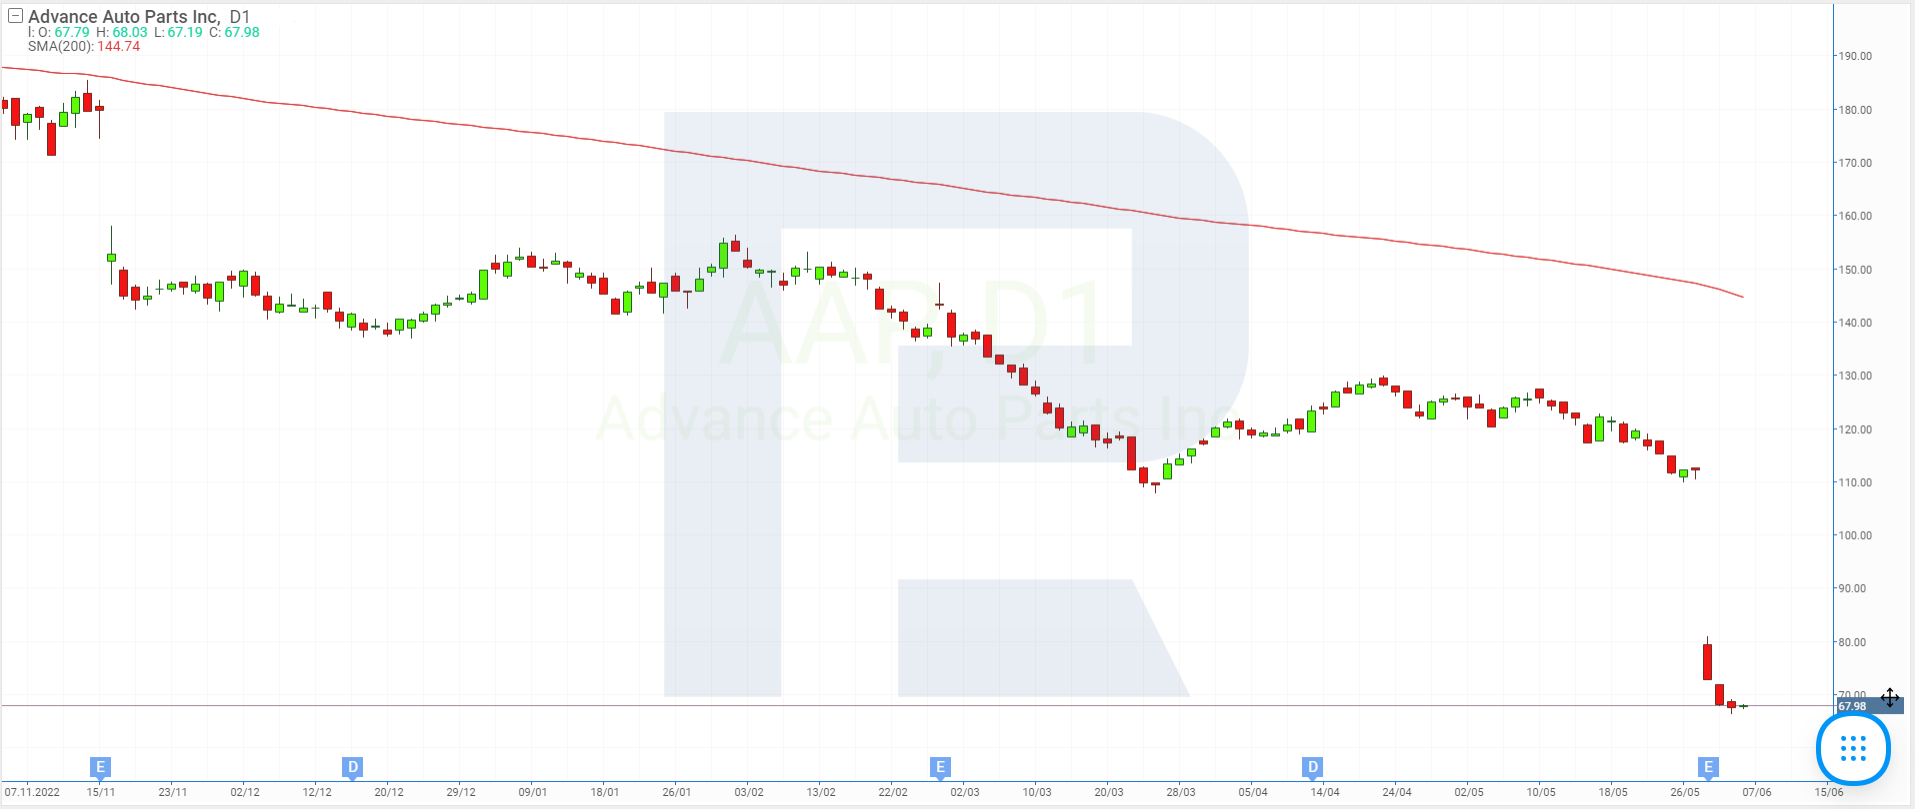
Advance Auto Parts Inc. (NYSE: AAP) stock declined 41.96% in the last month, dropping from 125.59 USD to 72.89 USD per share. On 31 May, the corporation released its results for the first quarter of 2023. Revenue recorded a 1.29% decline to 3.42 billion USD and net profit dropped 69.49% to 42.65 million USD or 0.72 USD per share.
In addition, it was announced that the Board of Directors had reduced the amount of quarterly dividends from 1.5 USD to 0.25 USD per share. The company’s management also lowered the annual revenue forecast from 11.4-11.6 billion USD to 11.2-11.3 billion USD and EPS from 10.2-11.2 USD to 6-6.5 USD.
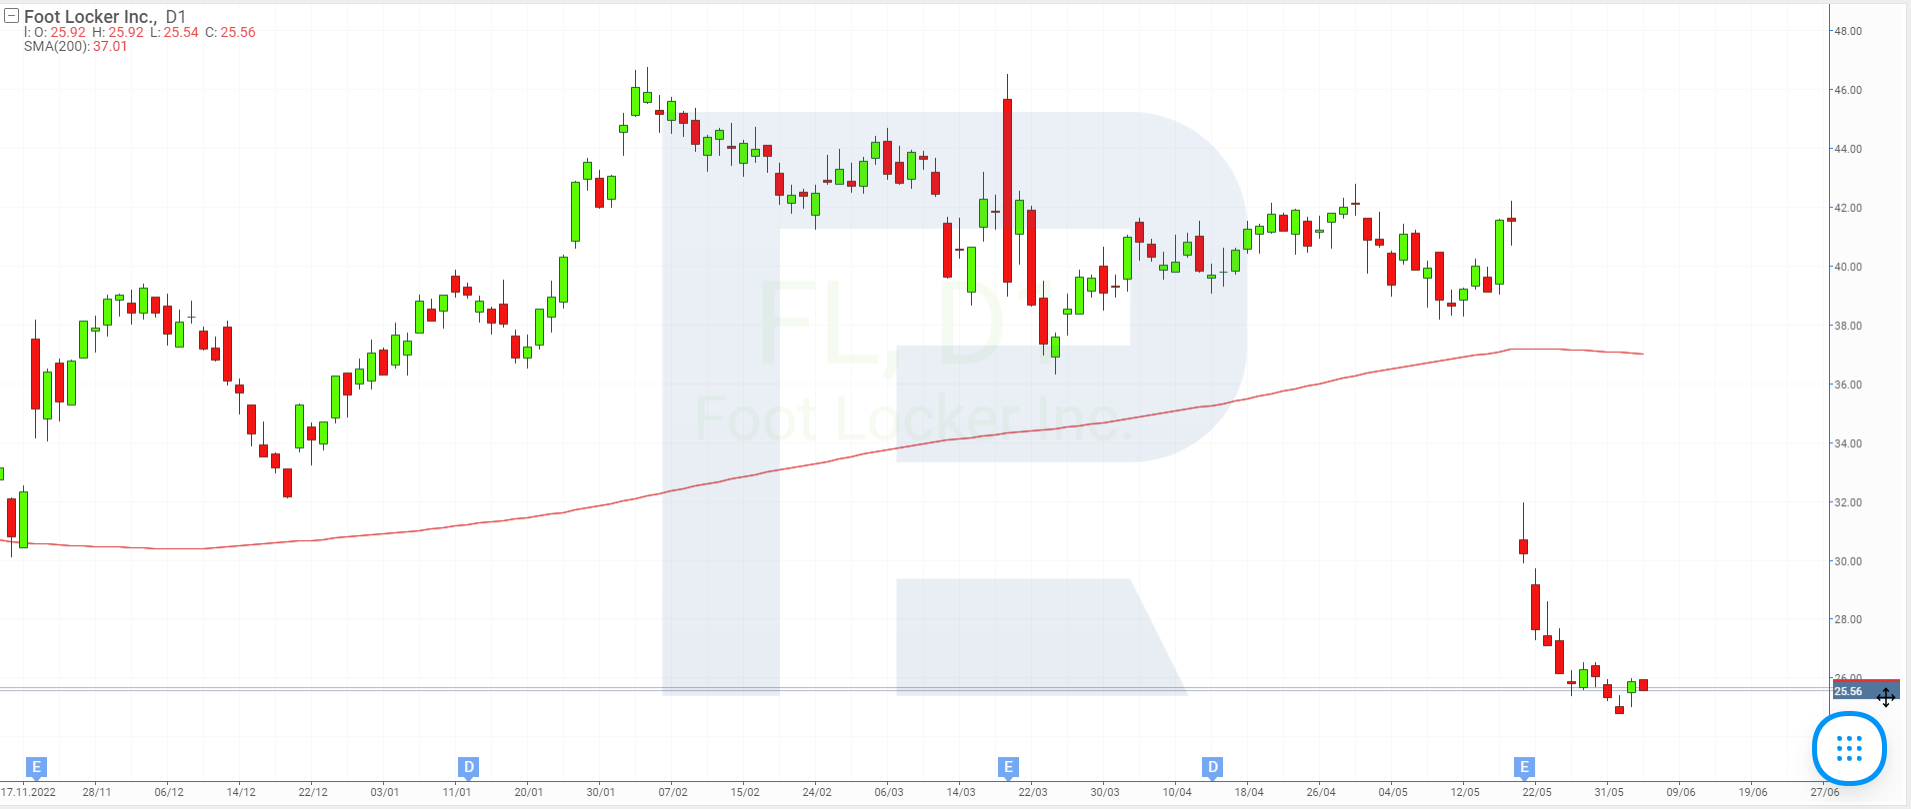
3. Foot Locker: −39.87%
Founded in: 1879
Registered in: the US
Headquarters: New York City, New York
Sector: consumer cyclical
Platform: NYSE
Market capitalisation: 2.32 billion USD
Foot Locker Inc., formerly known as Venator Group Inc. until 2001, is a footwear and apparel retailer. The company operates in the markets of North America, Europe, Asia, Australia, and New Zealand. It owns brands such as Foot Locker, Kids Foot Locker, Champs Sports, WSS, and atmos.
Foot Locker Inc. (NYSE: FL) quotes declined 39.87% in May, down from 42.11 USD to 25.32 USD. On 19 May, the corporation released its Q1 2023 report. Revenue for February to April dropped 11.34% to 1.93 billion USD, and net profit plummeted by 72.73% to 36 million USD or 0.38 USD per share.
4. iQIYI: −34.09%
Founded in: 2009
Registered in: China
Headquarters: Beijing, PRC
Sector: communication services
Platform: NASDAQ
Market capitalisation: 4.00 billion USD
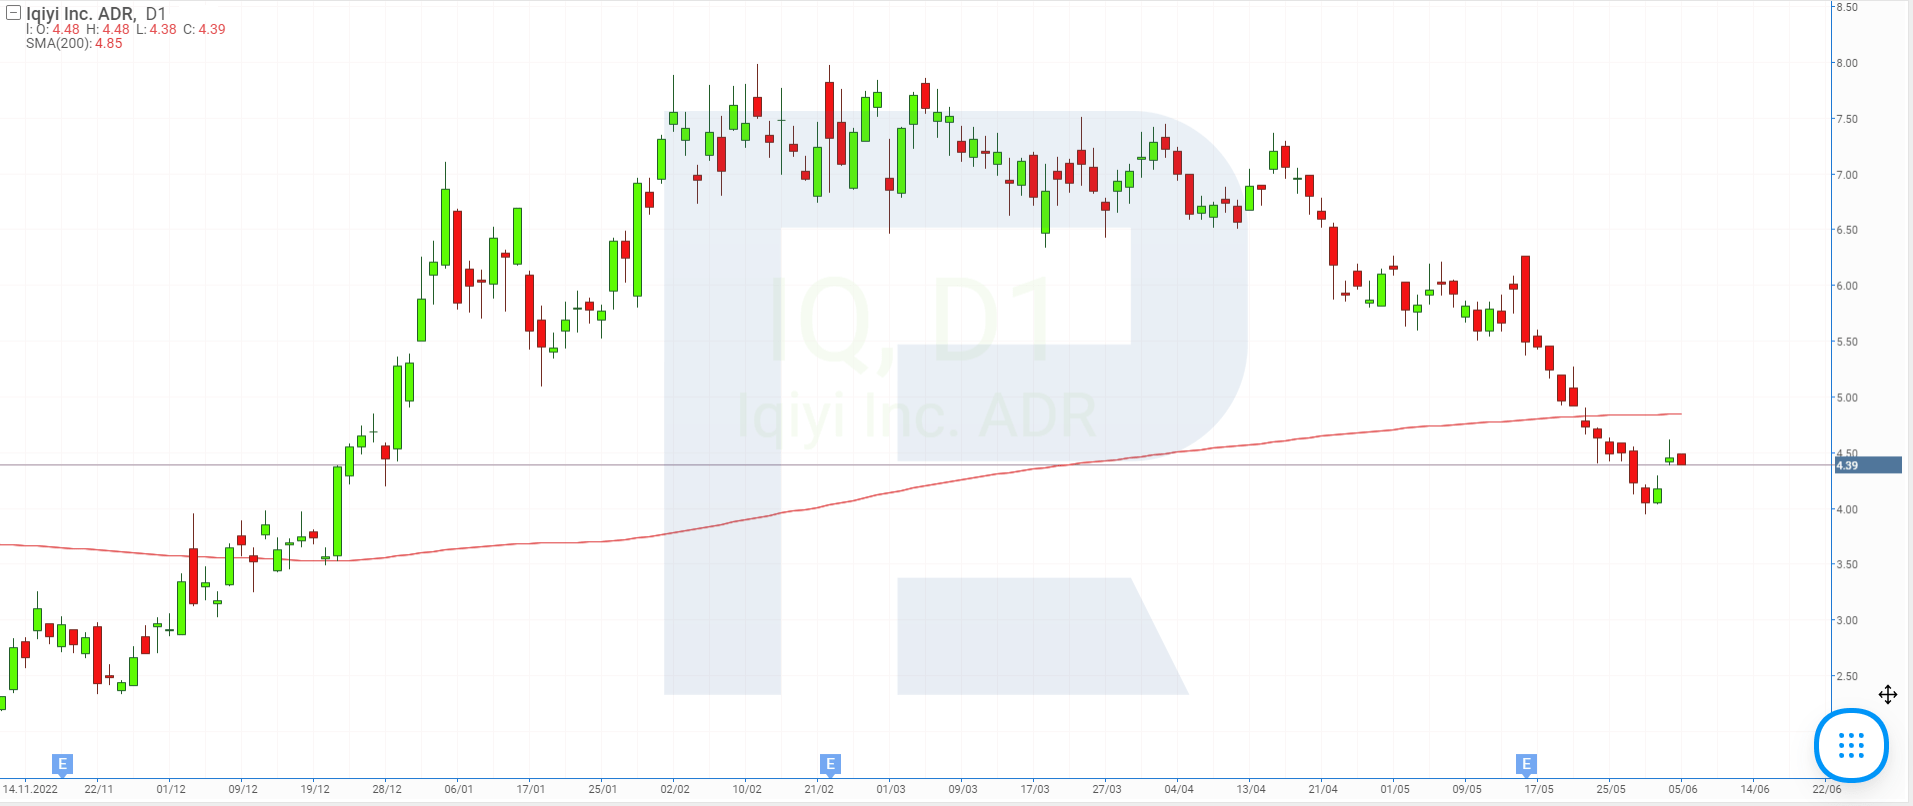
iQIYI Inc., formerly known as Qiyi.com Inc. until 2017, is involved in the online entertainment industry. Its primary market is China. where it is offering video games, video clips, literature, and animation. The company owns a specialised online platform where users can find a variety of entertainment content.
iQIYI Inc. (NASDAQ: IQ) stock plunged 34.09% in May, dropping from 6.16 USD to 4.06 USD per share. It is difficult to pinpoint a specific event that explains this decline. On 16 May, the company published its report for the first quarter of 2023, announcing a 14.73% increase in revenue to 8.35 billion RMB and a 265.54% surge in net profit to 618.11 million RMB or 0.64 RMB per share.
5. Bilibili: −21.93%
Founded in: 2009
Registered in: China.
Headquarters: Shanghai, PRC
Sector: communication services
Platform: NASDAQ
Market capitalisation: 6.52 billion USD
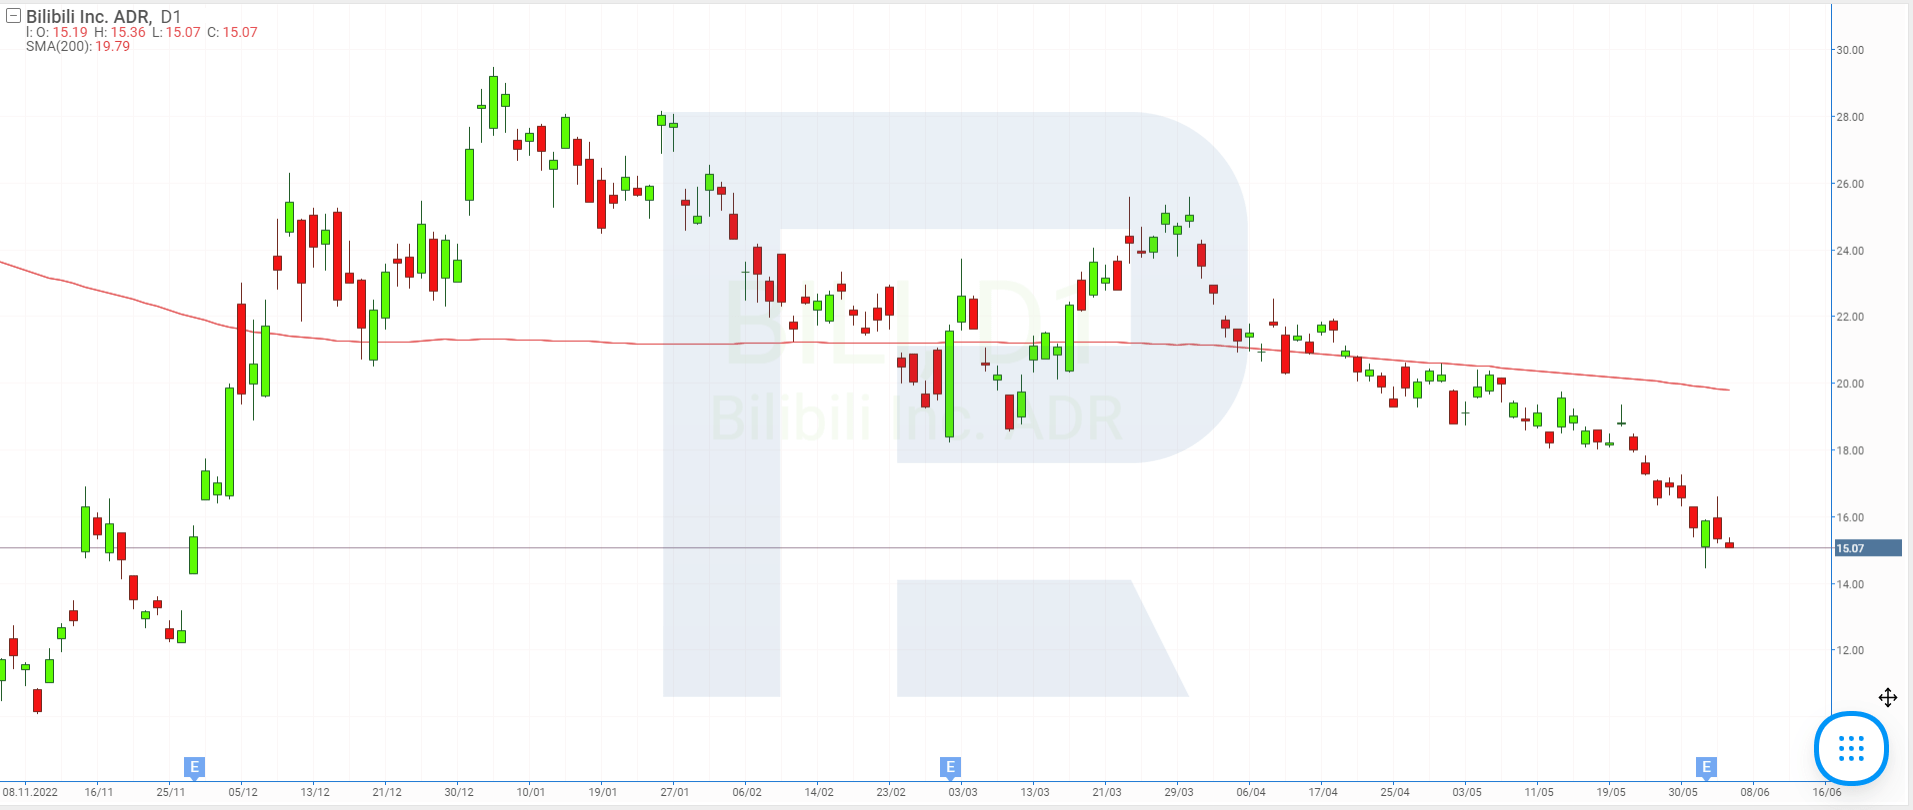
Bilibili Inc. specialises in online entertainment for young people. Its main audience market is in China, where the company develops online games, publishes comics, and owns audio services and platforms for creating and sharing video content.
Bilibili Inc. (NASDAQ: BILI) shares tumbled 21.93% during the past month, dropping from 20.06 USD to 15.66 USD. In the first quarter of this year, the corporation increased its revenue by only 0.31% to 5.07 billion RMB but managed to reduce its net loss by 72.43% to 629.65 million RMB or 1.53 RMB per share. It can be assumed that investors continue to be concerned about the profitability of Bilibili Inc.
Top stocks with prominent dynamics in May
Certain stocks recorded substantial growth in May, while others faced declines. Let's explore the top performers in both categories. The following companies were among the frontrunners in terms of stock gains last month: Upstart Holdings Inc., Palantir Technologies Inc., Carvana Co., Equitrans Midstream Corp., and Credo Technology Group Holding Ltd. On the other hand, Icahn Enterprises LP., Advance Auto Parts Inc., Foot Locker Inc., iQIYI Inc., and Bilibili Inc. saw the biggest decline in their stocks in May. The most popular factor that influenced the value of the above-mentioned companies’ securities was their quarterly reports.
* – Past performance is not a reliable indicator of future results or future performance.
The material presented and the information contained herein is for information purposes only and in no way should be considered as the provision of investment advice for the purposes of Investment Firms Law 87(I)/2017 of the Republic of Cyprus or any other form of personal advice or recommendation, which relates to certain types of transactions with certain types of financial instruments.






 are complex instruments and come with a high
  of losing
  rapidly due to
  . 65.68% of retail investor accounts lose
  when trading
  with this provider. You should consider whether you understand how CFDs work and whether you can afford to take the high