Top Gaining and Losing Stocks of June 2023
9 minutes for reading
Aurora Innovation Inc., Carvana Co., Joby Aviation Inc., Carnival Corporation, and Wayfair Inc. were among the top five growth stocks in June. Meanwhile, NovoCure Limited, SentinelOne Inc., HashiCorp Inc., Smartsheet Inc., and Okta Inc. were the five companies that faced notable declines last month.
Selection criteria for companies
- The stock is traded on the NYSE and NASDAQ
- The share price exceeds 2 USD
- The companies are not classified as funds
- Their market capitalisation is over 2 billion USD
- The average trading volume for the last 30 days is more than 750,000 shares
Growth and decline values were determined as the percentage difference between the opening prices on 1 June and the closing prices on 30 June 2023. The market capitalisation of the companies was valid as of the time of writing.
Stocks with the most significant gains in June 2023
1. Aurora Innovation: +102.75%
Founded in: 2017
Registered in: the US
Headquarters: Pittsburgh, Pennsylvania
Sector: technology
Platform: NASDAQ
Market capitalisation: 3.47 billion USD
Aurora Innovation Inc. develops autonomous driving technologies for cars and trucks. The company collaborates with major players in the transport and automotive sectors such as Toyota Motor Corporation, FedEx Corporation, Volvo Trucks, PACCAR Inc., Uber Technologies Inc., US Xpress Enterprises Inc., Werner Enterprises Inc., Covenant Logistics Group Inc., Schneider National Inc., and Ryder System Inc.
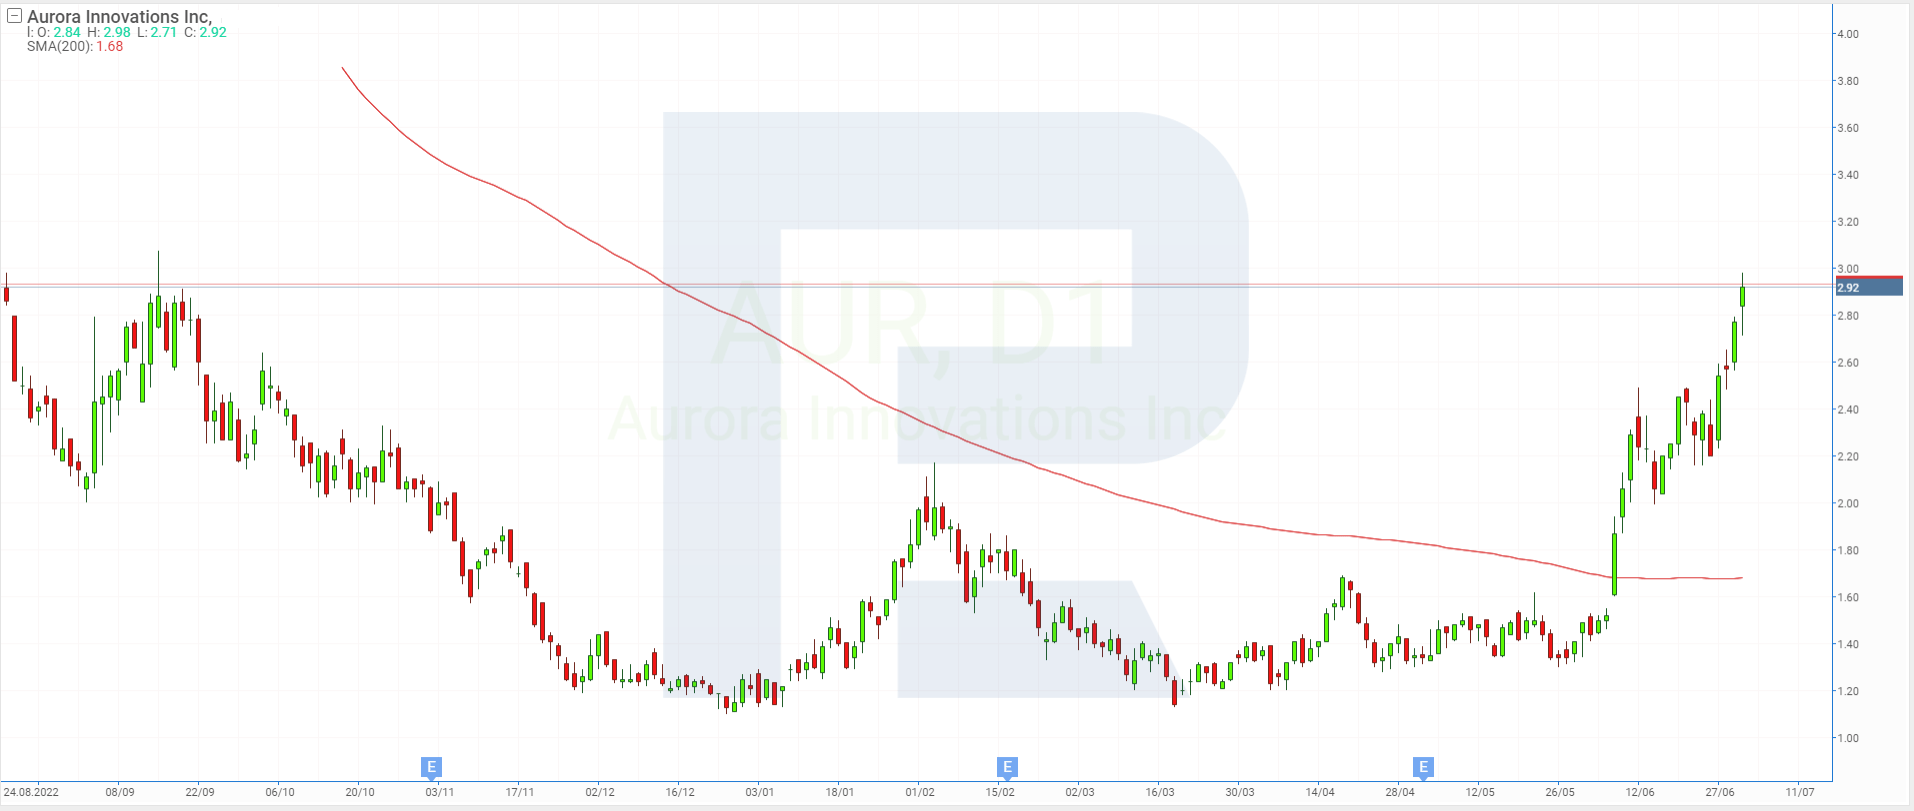
Aurora Innovation Inc. (NASDAQ: AUR) stock skyrocketed 102.75% in June, surging from 1.45 USD to 2.94 USD per share. This significant growth can be attributed to a report published by Canaccord Genuity analyst George Gianarikas at the beginning of the month. In the document, the annual target price for the corporation’s stock was set at 5 USD per share. This is more than three times its value at the time.
2. Carvana: +87.82%
Founded in: 2012
Registered in: the US
Headquarters: Tempe, Arizona
Sector: consumer cyclical
Platform: NYSE
Market capitalisation: 4.93 billion USD
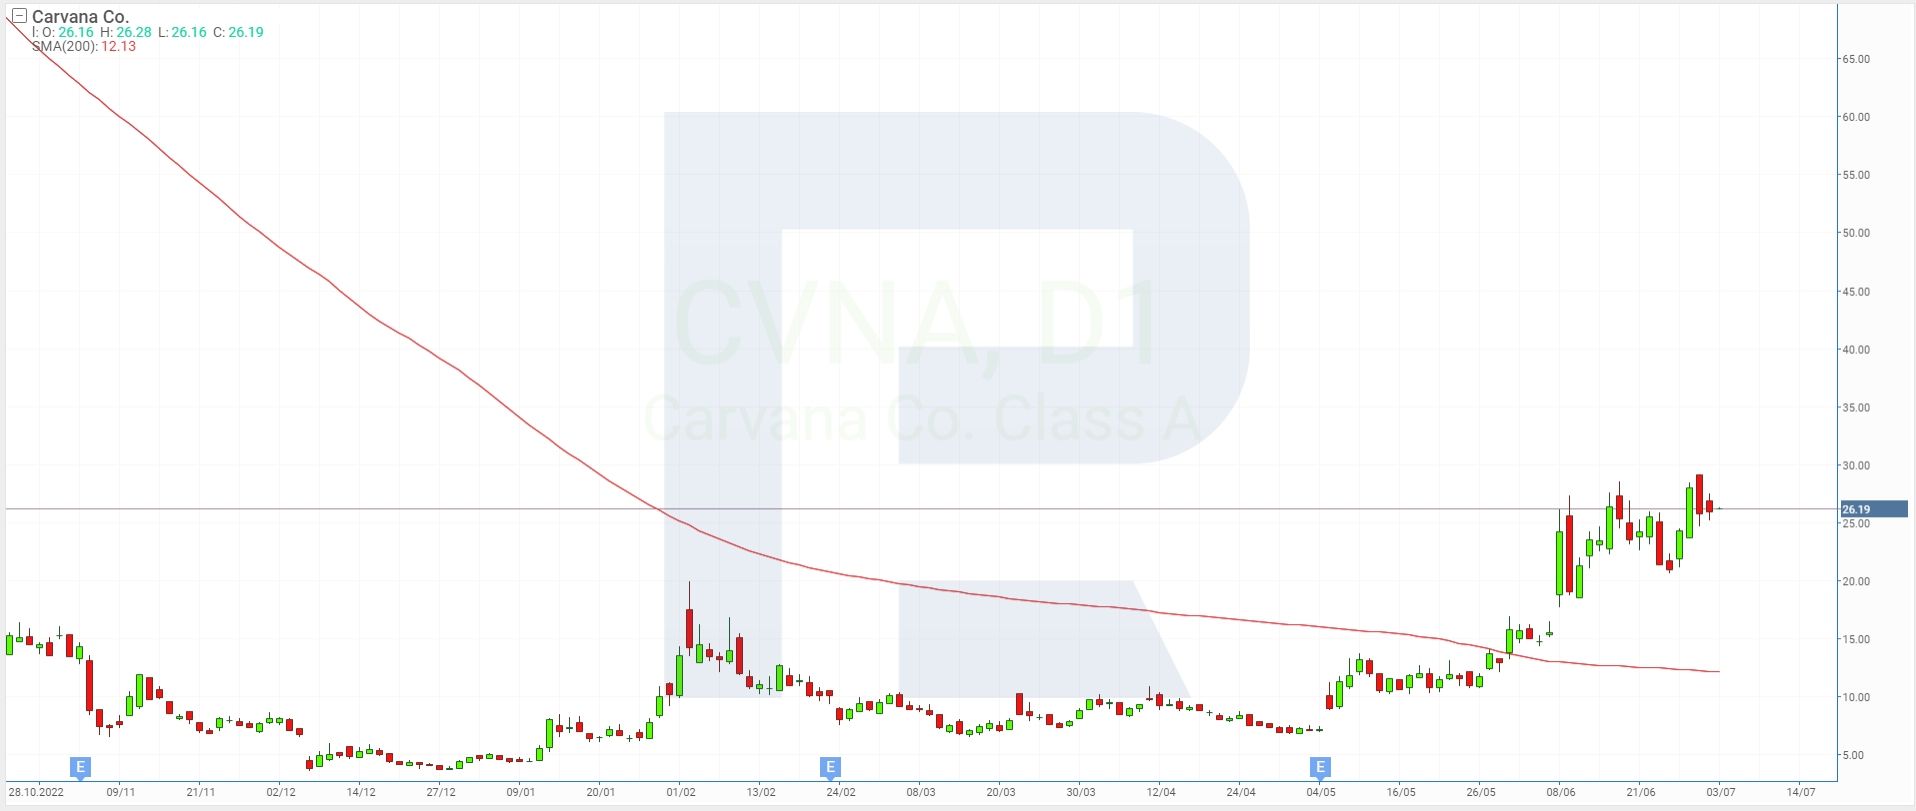
Carvana Co. owns an online platform for buying and selling used cars in the US. Following the results of the previous month, Carvana Co. (NYSE: CVNA) stock increased by 87.82% rising from 13.80 USD to 25.92 USD per share. Recall that the company posted a 77.23% growth in May, thereby ranking third and securing its position among the top 5 gaining stocks in that month.
On 8 June, Carvana Co.’s management improved its EBITDA forecast for the second quarter of this year, expecting it to reach 50 billion USD. This is probably what pushed the company’s quotes up.
3. Joby Aviation: +81.91%
Founded in: 2009
Registered in: the US
Headquarters: Santa Cruz, California
Sector: manufacturing
Platform: NYSE
Market capitalisation: 6.93 billion USD
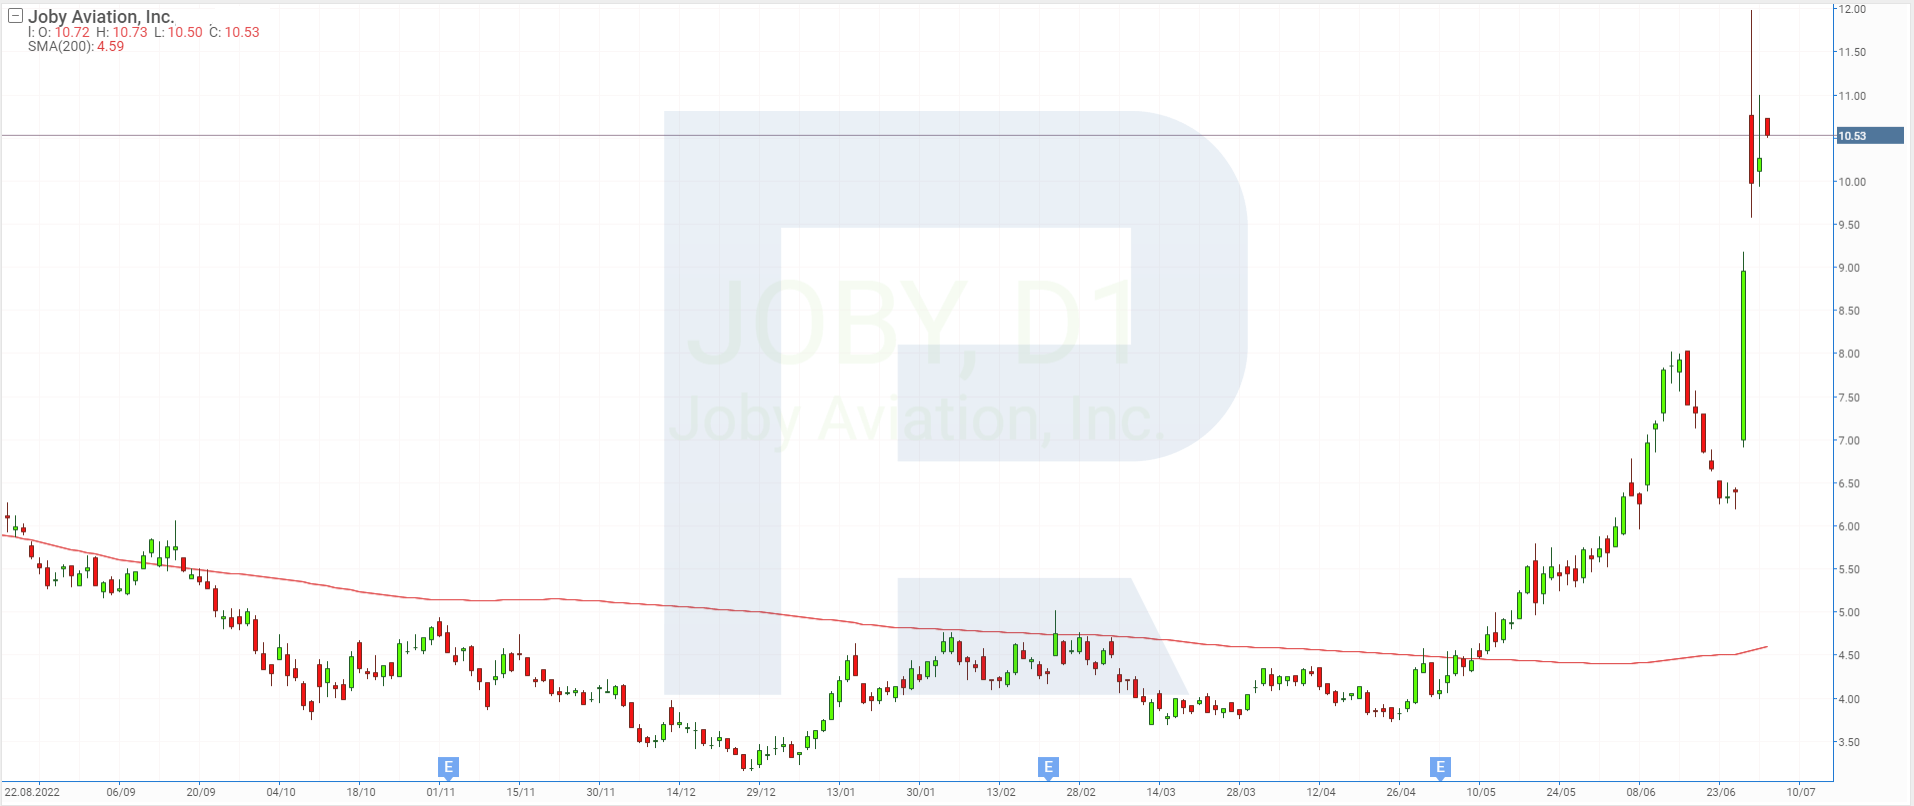
The shares of Joby Aviation Inc. (NYSE: JOBY), which develops and manufactures fully electric aircraft for commercial passenger transportation, gained 81.91% over the past month, rising from 5.64 USD to 10.26 USD.
On 28 June, the corporation published a press release on its website stating that the US Federal Aviation Administration (FAA) had approved flight tests for its first production prototype. On the same day, it was announced that Tetsuo Ogawa, Toyota Motor North America Inc.’s President and CEO, had joined the Board of Directors of Joby Aviation Inc.
On 29 June, the corporation announced that it had received a 100 million USD investment from SK Telecom Co. Ltd., South Korea’s telecommunications company. Collaborating with SK Telecom Co. Ltd. could create favourable conditions for Joby Aviation Inc. to enter the South Korean market.
4. Carnival Corporation: +66.34%
Founded in: 1972
Registered in: the US
Headquarters: Miami, Florida
Sector: consumer cyclical
Platform: NYSE
Market capitalisation: 23.46 billion USD
Carnival Corporation & plc, with a fleet of over 90 ships, is one of the world’s leading cruise operators. It is the owner of Carnival Cruise Lines, Princess Cruises, Holland America Line, Seabourn Cruise Line, P&O Cruises, and 15 other subsidiaries.
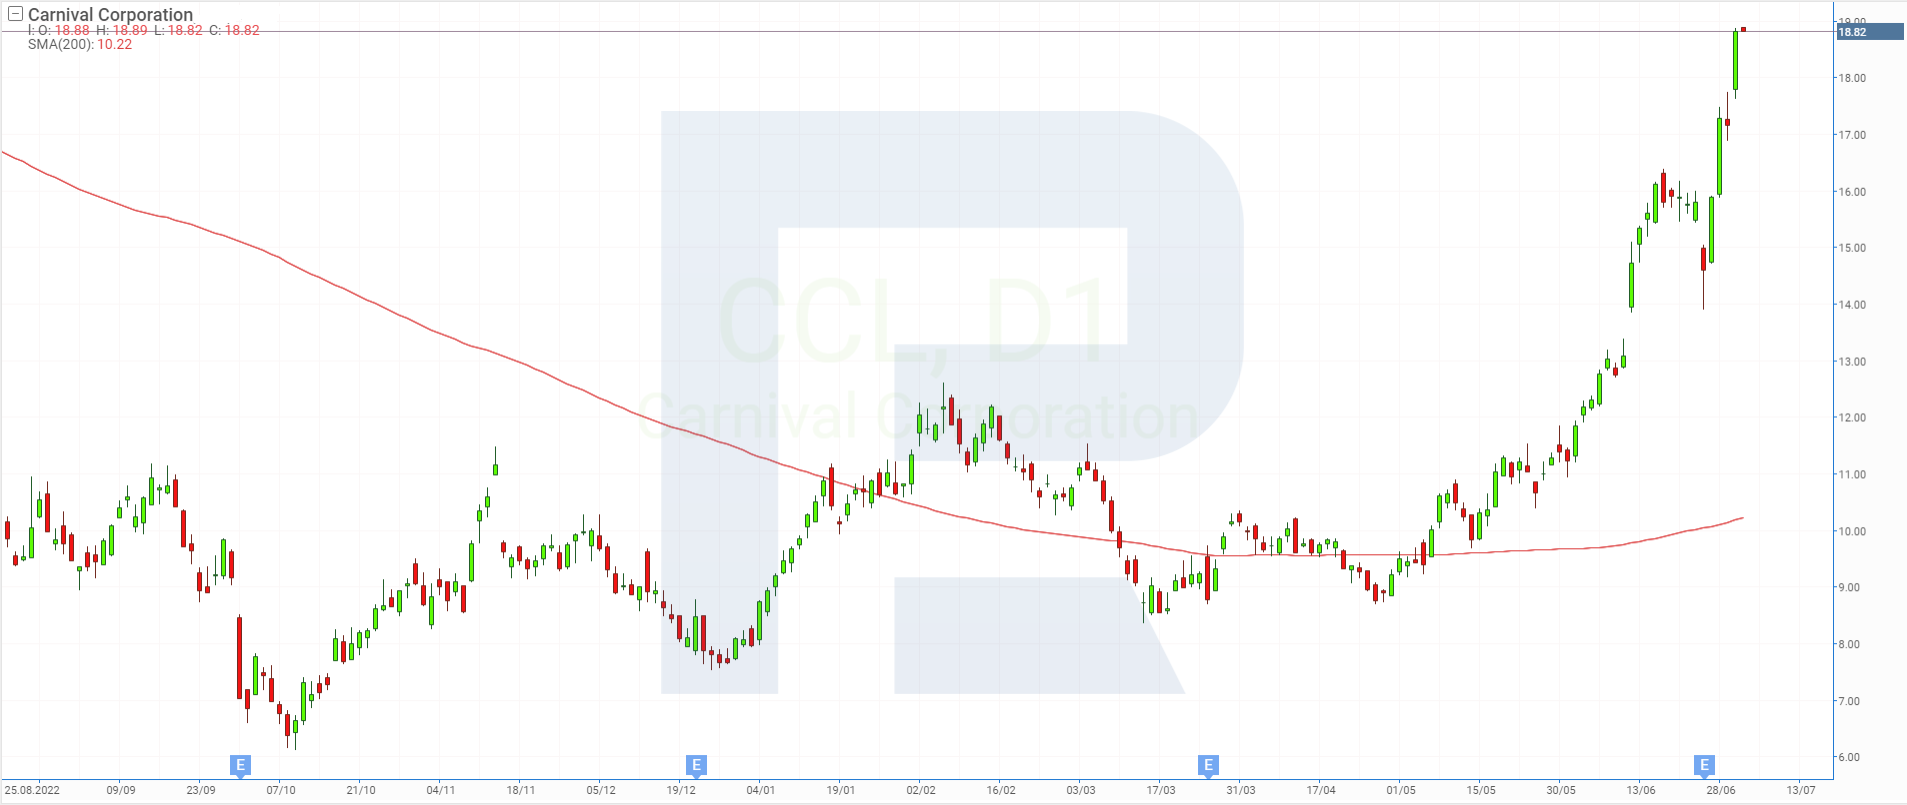
Carnival Corporation & plc (NYSE: CCL) gained 66.34% in June, rising from 11.32 USD to 18.83 USD per share. The company released its Q2 2023 report on 26 June.
Compared to the corresponding period of last year, revenue for March to May increased by 104.54% up to a record 4.91 billion USD, while net loss decreased by 77.81% to 407 million USD or 0.32 USD per share. Carnival Corporation & plc noted ongoing growing demand with the number of bookings for the quarter reaching a new all-time high.
5. Wayfair: +62.60%
Founded in: 2002
Registered in: the US
Headquarters: Boston, Massachusetts
Sector: consumer cyclical
Platform: NYSE
Market capitalisation: 7.25 billion USD
Wayfair Inc. is one the world’s largest online retailers of home goods. Operating under the Wayfair, Joss & Main, AllModern, Birch Lane, and Perigold brands, the company offers over 33 million items from more than 23 thousand suppliers.
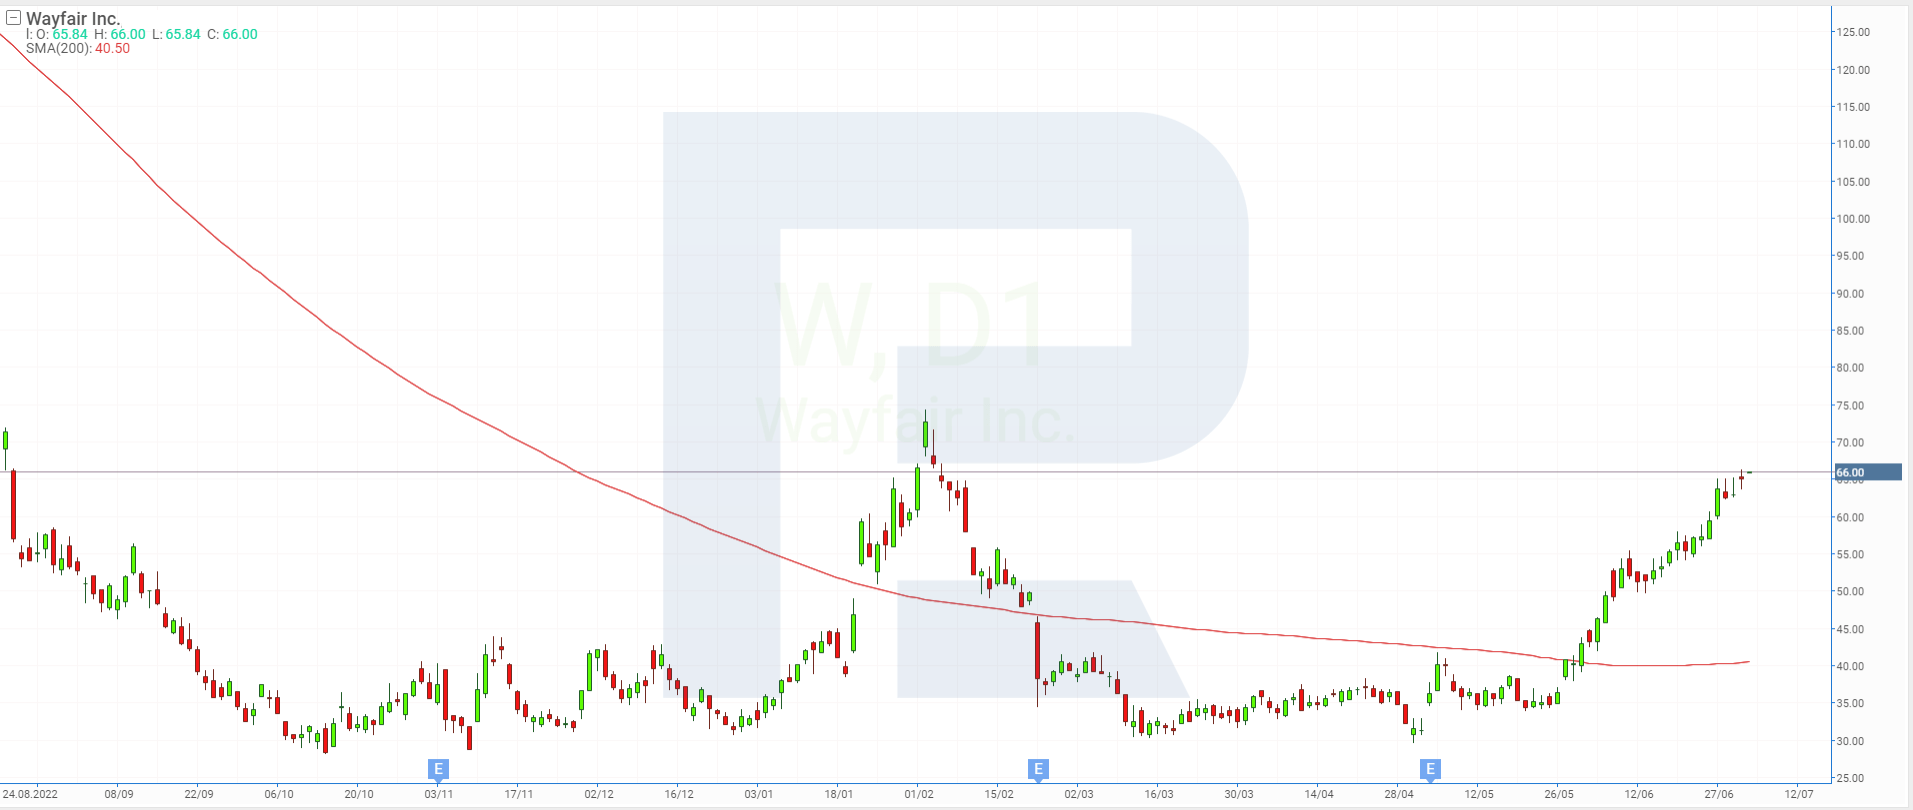
Wayfair Inc. (NYSE: W) stock saw a 62.60% increase over the last month, rising from 39.98 USD to 65.01 USD. It is difficult to pinpoint any specific event that could explain this growth. Recall that the corporation was also among the top 5 gaining stocks in January.
Stocks with the most prominent declines in June 2023
1. NovoCure: −42.60%
Founded in: 2000
Registered in: the US
Headquarters: Saint Helier, Jersey
Sector: healthcare
Platform: NASDAQ
Market capitalisation: 4.41 billion USD
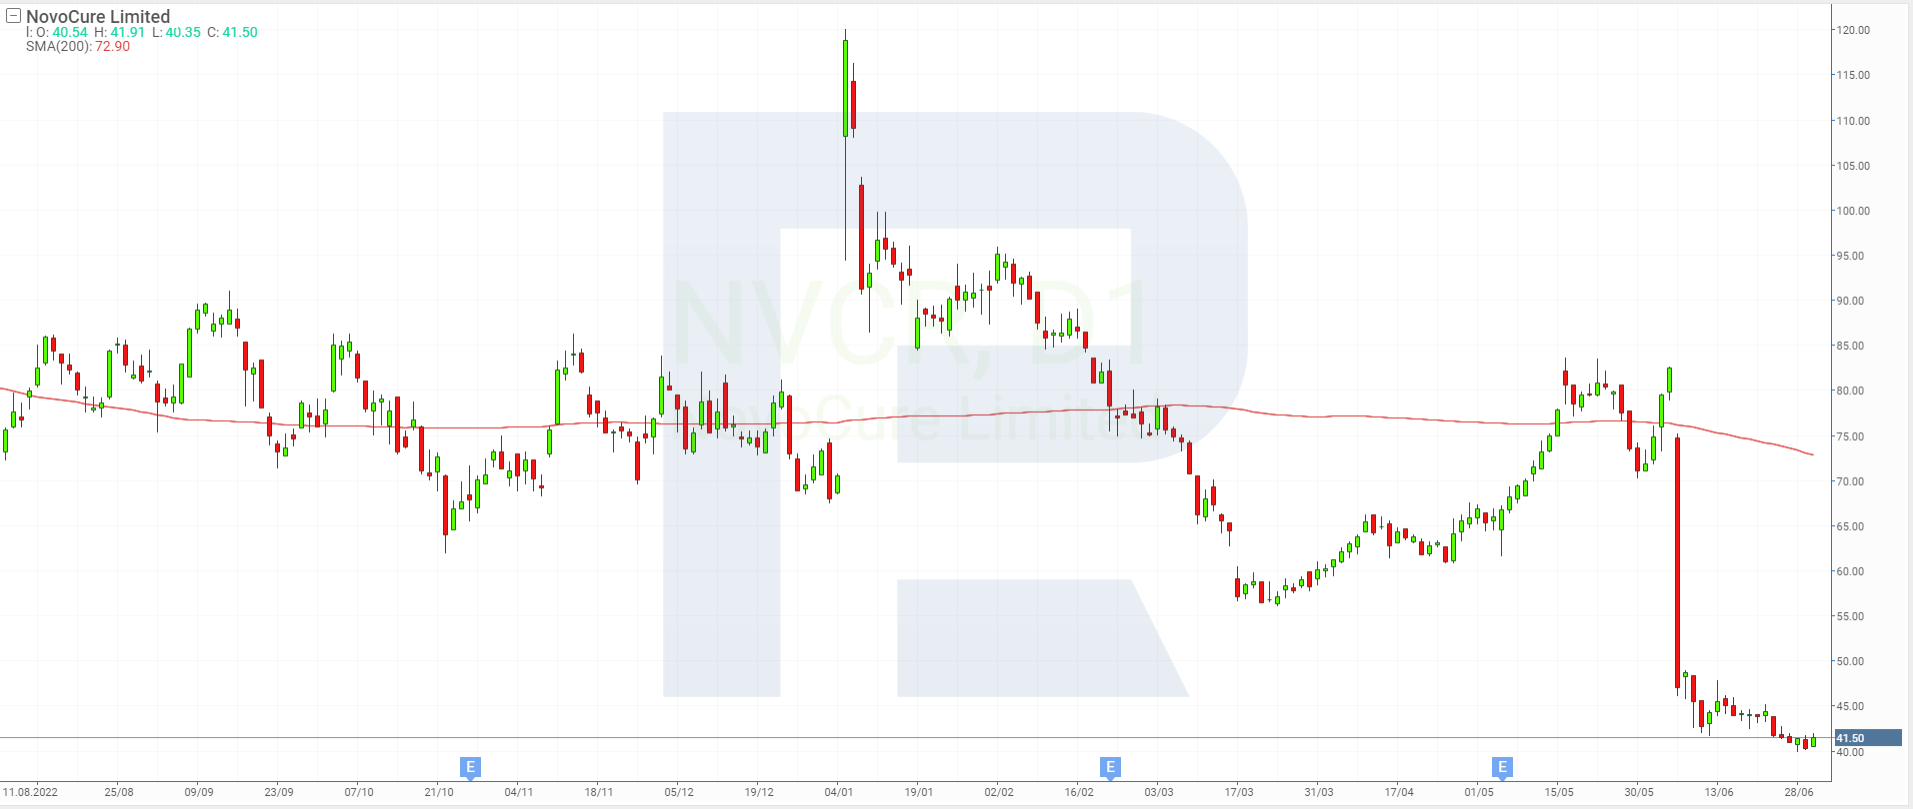
NovoCure Limited develops, manufactures, and markets special-purpose equipment for the treatment of cancer. NovoCure Limited (NASDAQ: NVCR) shares lost 42.60% in June, dropping from 72.3 USD to 41.5 USD per unit.
On 6 June, NovoCure Limited announced positive results for the use of Tumor Treating Fields (TTFields) therapy when treating non-small cell lung cancer (NSCLC). However, analysts were indignant about the methodology of the study and the way patients were treated.
2. SentinelOne: −25.46%
Founded in: 2013
Registered in: the US
Headquarters: Mountain View, California
Sector: technology
Platform: NYSE
Market capitalisation: 4.42 billion USD
SentinelOne Inc. known as Sentinel Labs Inc. until 2021 provides cybersecurity services. Its platform, Singularity, which uses AI technology, enables rapid threat detection and a high level of protection.
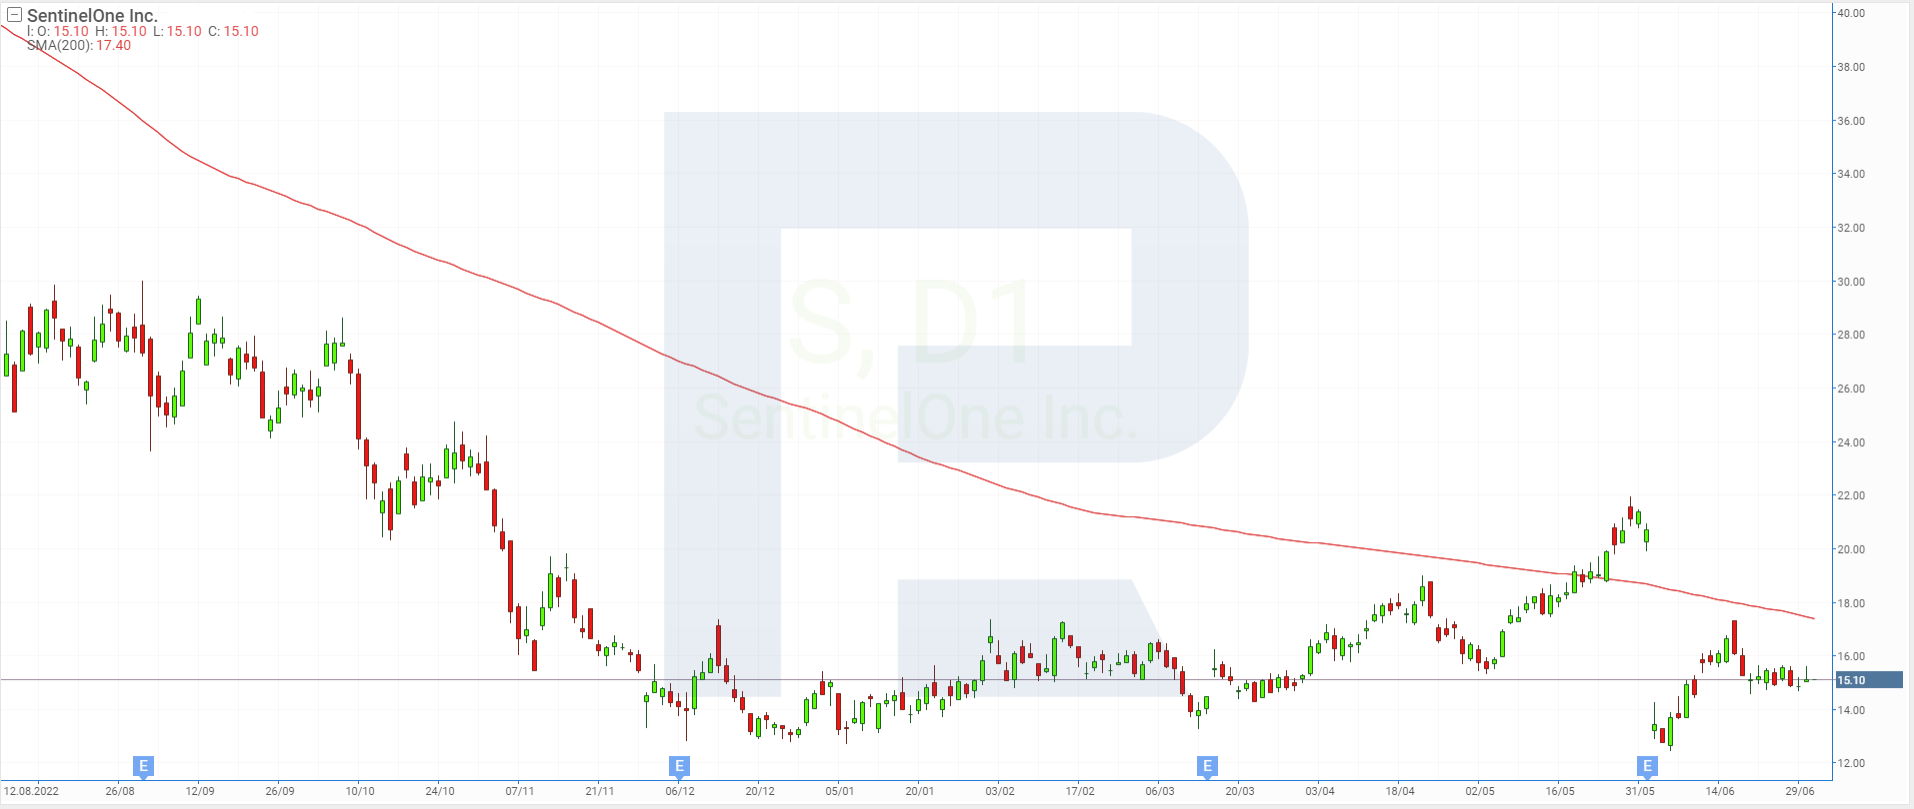
SentinelOne Inc. (NYSE: S) stock saw a 25.46% decline over the past month, dropping from 20.26 USD to 15.1 USD per unit. The corporation reported its Q1 fiscal 2024 results on 1 June. Revenue for February to April increased by 70.46% reaching 133.39 million USD, which is the lowest reading since the IPO. Net loss was up 18.96% up to 106.87 million USD or 0.37 USD per share.
On 2 June, analysts lowered the target price for SentinelOne Inc. shares to 18 USD per unit, citing longer deal cycles for the technology corporation and reduced demand for its services from enterprise customers. These clients are refraining from new orders, probably due to high inflation and rising interest rates in the US.
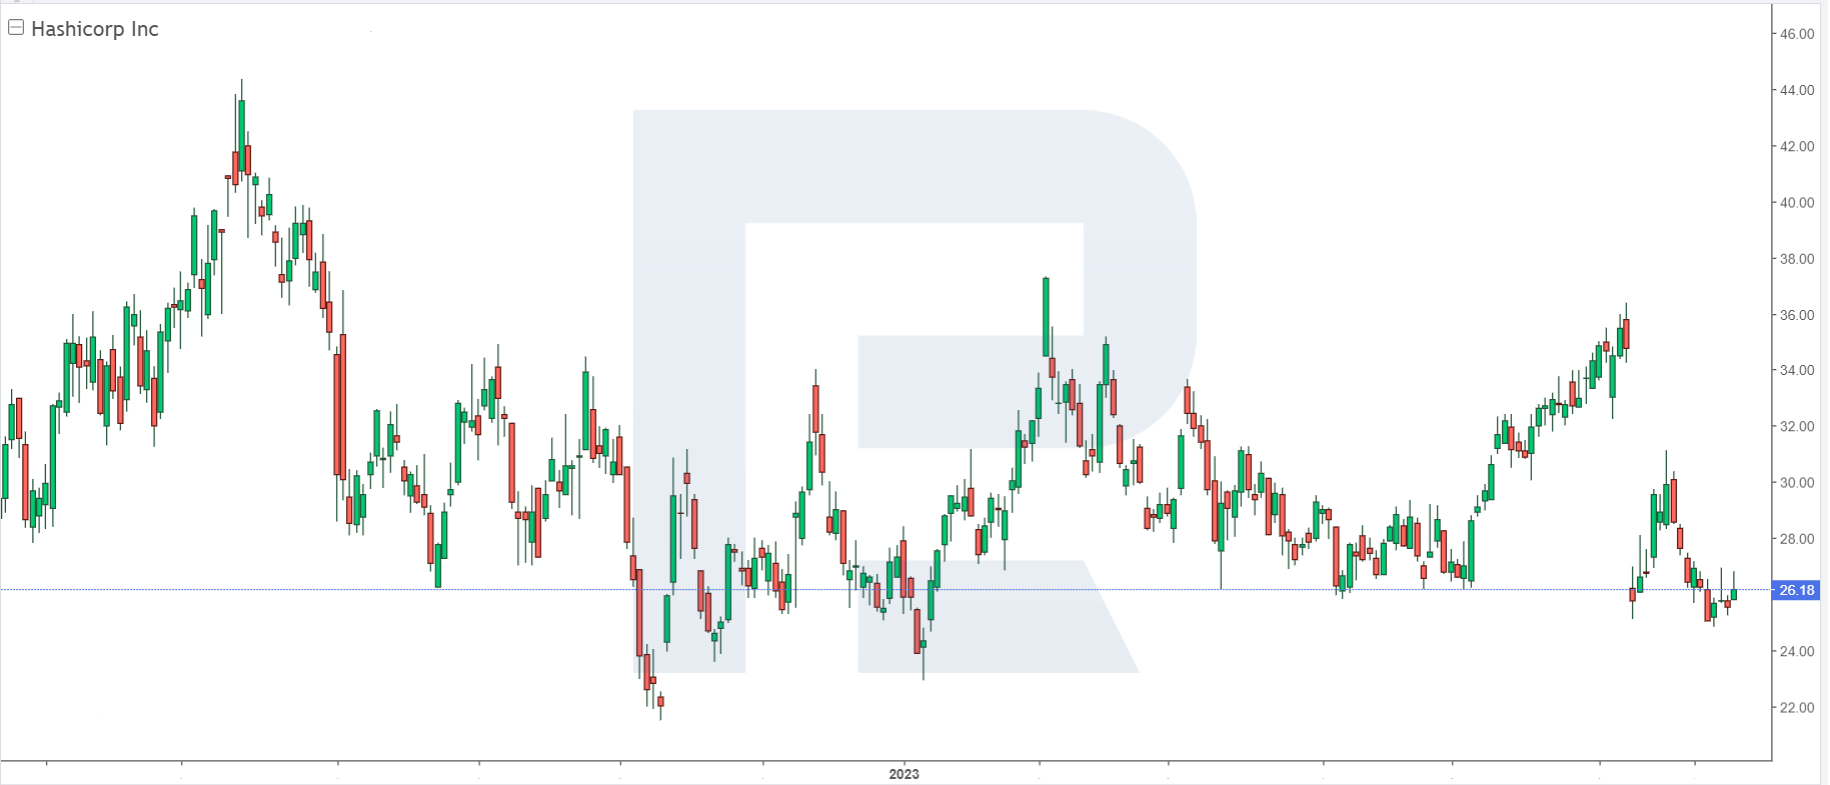
3. HashiCorp: −22.40%
Founded in: 2012
Registered in: the US
Headquarters: San Francisco, California
Sector: technology
Platform: NASDAQ
Market capitalisation: 5.07 billion
The stock of HashiCorp Inc. (NASDAQ: HCP), which specialises in cloud software development, tumbled 22.40% from 33.74 USD to 26.18 USD over the period in question. On 7 June, the corporation released its Q1 fiscal 2024 report, recording a 36.76% increase in revenue for February to April to 137.98 million USD and a 31.91% decline in net loss to 53.26 million USD or 0.28 USD per share.
However, HashiCorp Inc.’s management noted that the company’s clients are reducing their spending on IT services. As a result, it revised the revenue forecast for the 2024 fiscal year downward from 591-595 million USD to 564-570 million USD. In addition, the corporation plans to lower its expenses by laying off 8% of its workforce.
4. Smartsheet: −21.17%
Founded in: 2005
Registered in: the US
Headquarters: Bellevue, Washington
Sector: technology
Platform: NYSE
Market capitalisation: 5.23 billion USD
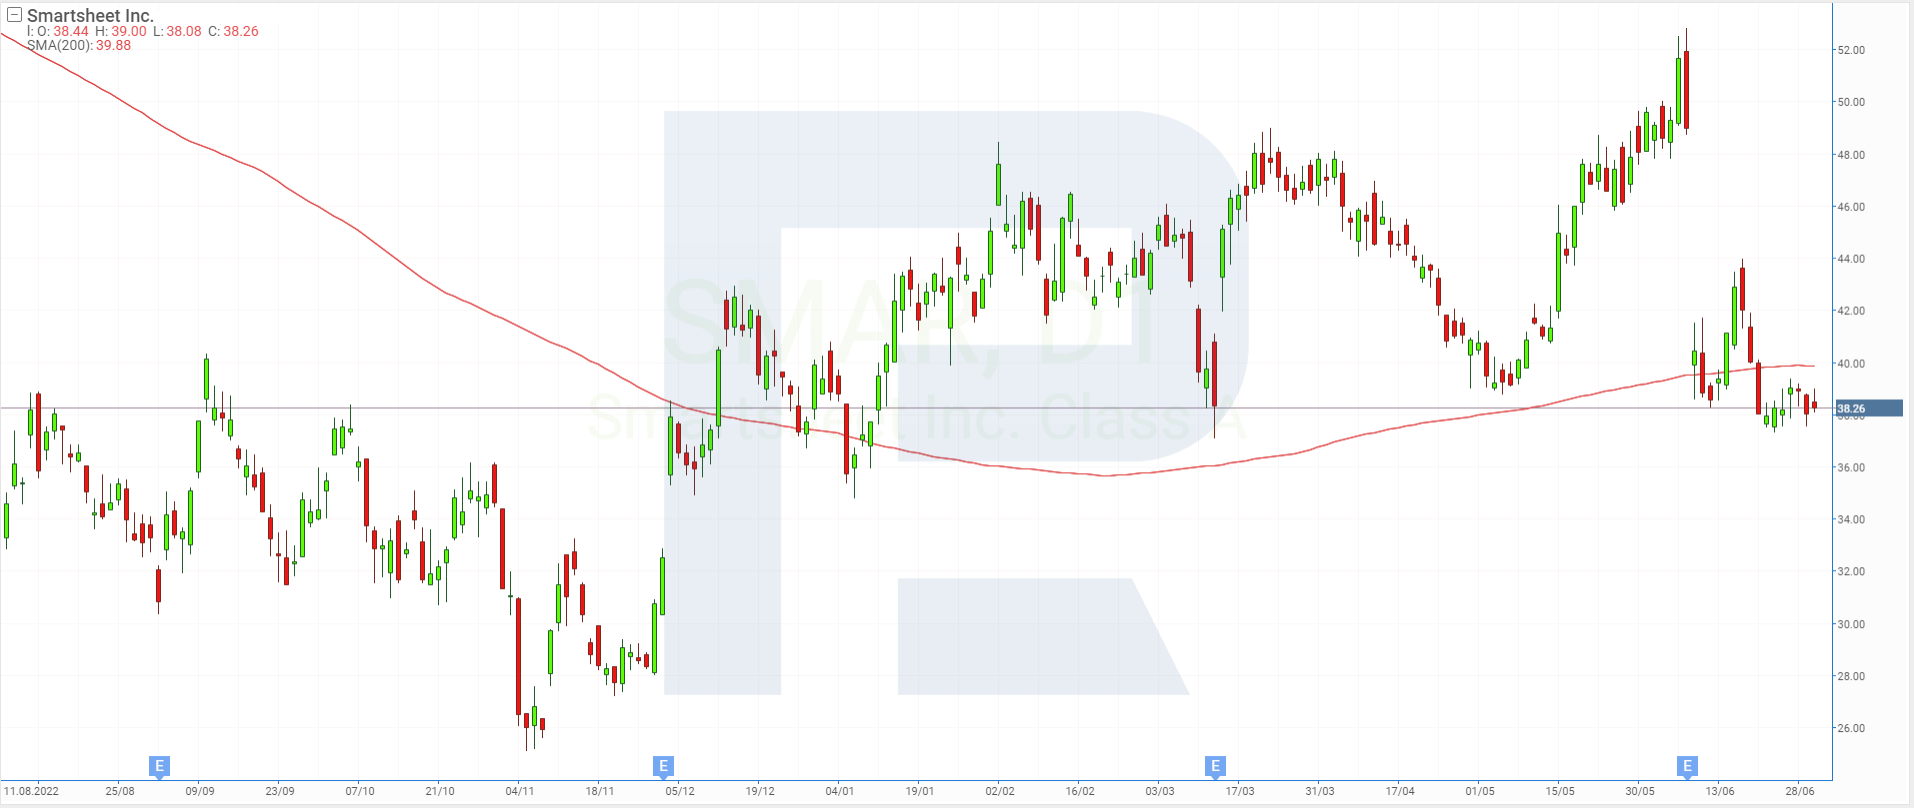
Smartsheet Inc. owns an online enterprise platform of the same name, designed for project management, workflow automation, task planning, and scaling. Smartsheet Inc. (NYSE: SMAR) stock sank 21.17% from 48.54 USD to 38.26 USD based on June results.
The corporation reported its Q1 fiscal 2024 results on 7 June. Revenue for February to April added 30.64% reaching 219.89 million USD, while net loss decreased by 57.61% to 29.87 million USD or 0.23 USD per share. Despite the positive quarterly statistics, Smartsheet Inc. shares declined during the month.
The company’s management probably failed to reassure investors and shareholders, who are concerned about the developing trend of decreasing demand for corporate IT products and services.
5. Okta: −6.46%
Founded in: 2009
Registered in: China
Headquarters: San Francisco, California
Sector: technology
Platform: NASDAQ
Market capitalisation: 11.26 billion USD
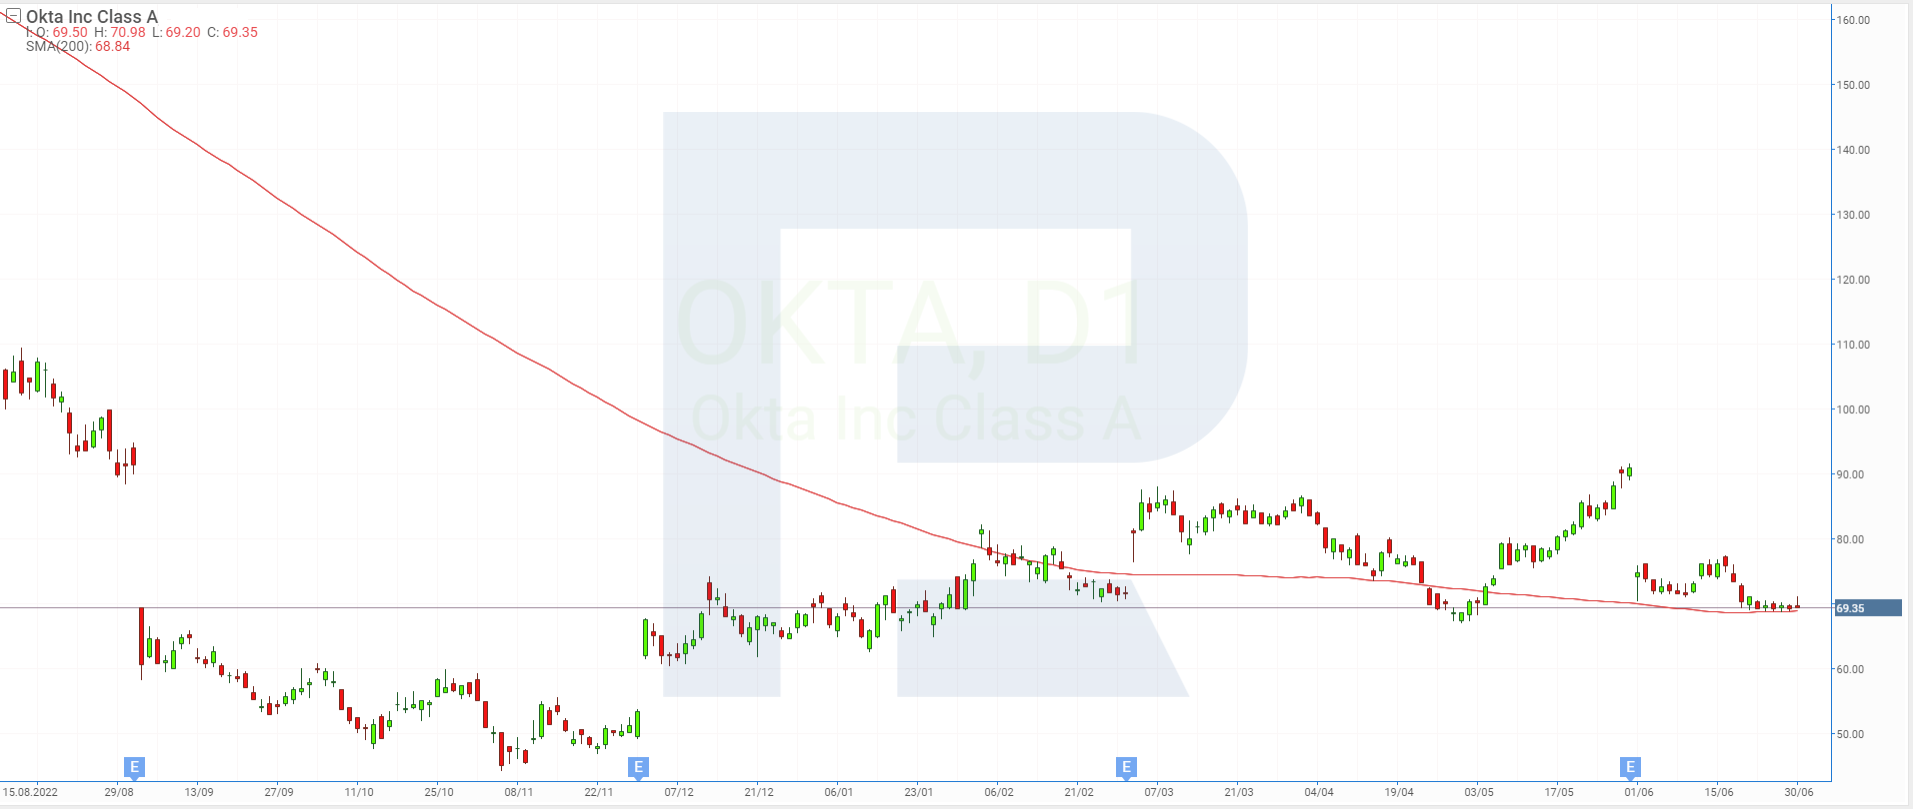
The stock of Okta Inc. (NASDAQ: OKTA), which develops corporate software solutions for identity and secure data access management, lost 6.46% in June, dropping from 74.14 USD to 69.35 USD per share. The company released its Q1 fiscal 2024 report on 31 May.
Okta Inc.’s revenue for the three months ended on 30 April showed an increase of 24.82% up to 518 million USD, while net loss decreased by 51.03% to 119 million USD or 0.74 USD per share. The company expects the Q2 revenue to be 533-535 million USD, with the annual indicator reaching 2.18-2.19 billion USD.
At the same time, operating losses amounted to 160 million USD, which accounts for 31% of the quarterly revenue. The corporation attributes this to additional costs for the ongoing integration of the acquired Auth0 Inc. with Okta Inc.’s business.
Top stocks with prominent dynamics in June
The leaders of stock price gains in June were Aurora Innovation Inc., Carvana Co., Joby Aviation Inc., Carnival Corporation, and Wayfair Inc. In most cases, these companies had individual reasons for the appreciation of their stocks.
On the other hand, NovoCure Limited, SentinelOne Inc., HashiCorp Inc., Smartsheet Inc., and Okta Inc. saw the biggest decline in their stocks last month. Out of the five companies, four belong to the technology sector. Their quotes were negatively affected by the overall trend of decreasing demand for corporate IT products and services, amid an environment of high inflation and rising interest rates in the US.
* – Past performance is not a reliable indicator of future results or future performance.
The material presented and the information contained herein is for information purposes only and in no way should be considered as the provision of investment advice for the purposes of Investment Firms Law 87(I)/2017 of the Republic of Cyprus or any other form of personal advice or recommendation, which relates to certain types of transactions with certain types of financial instruments.













 are complex instruments and come with a high
  of losing
  rapidly due to
  . 65.68% of retail investor accounts lose
  when trading
  with this provider. You should consider whether you understand how CFDs work and whether you can afford to take the high