Top Warren Buffett Stocks in 2023
11 minutes for reading
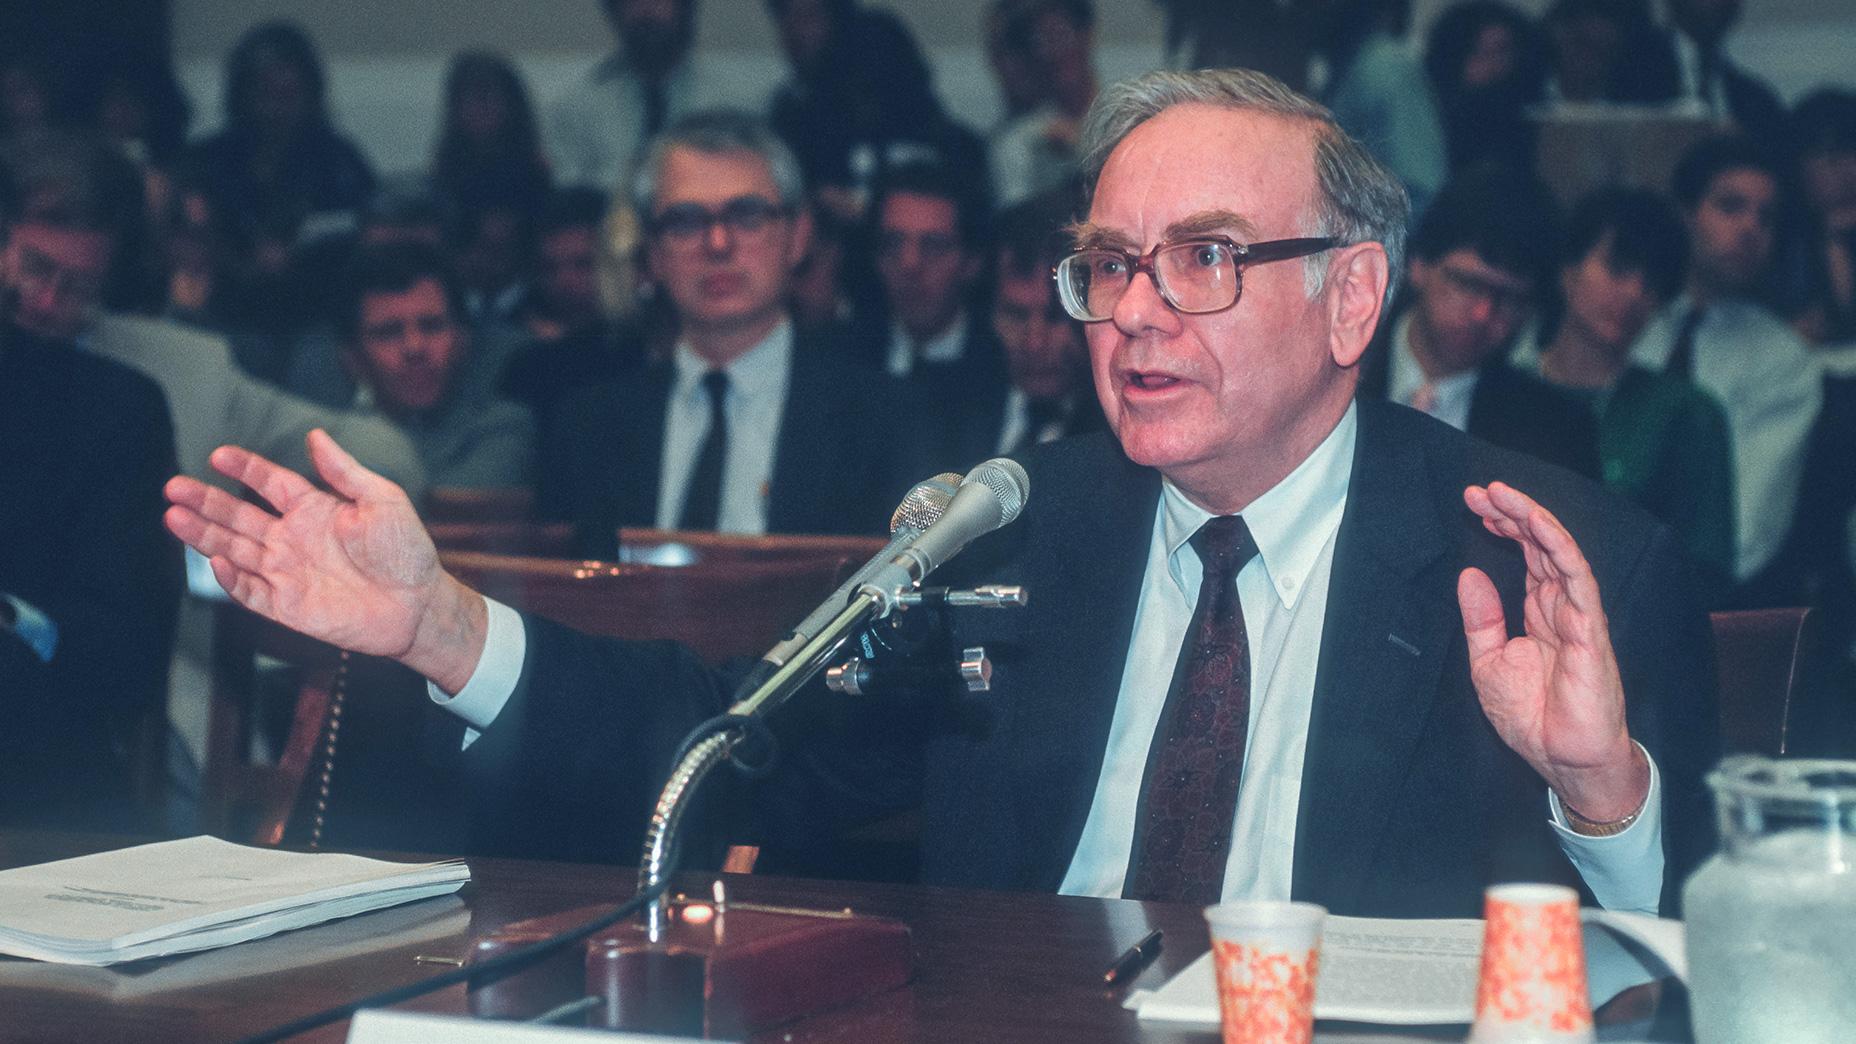
Warren Buffett is one of the most popular American investors. Today, on 7 November 2023, we will look at his most significant deals, discuss his fund Berkshire Hathaway Inc. (NYSE: BRK.A), and list his core investing principles. Most importantly, we will share details about the Oracle of Omaha's portfolio holdings. We will specifically name the top 3 stocks by investment volume for Q2 2023 and the top 3 stocks with the largest holdings in Buffett's portfolio. Last, we will provide you with the latest technical analysis of the stock charts.
Warren Buffett’s investing principles
In its PRO INVESTOR EDUCATION, CNBC listed Warren Buffett's core investing principles he has consistently outlined in his interviews, at annual meetings, and in letters to Berkshire Hathaway Inc.'s shareholders. Here are the main ones:
- Follow a buy-and-hold strategy
- Do not attempt to time stock price fluctuations
- Do not risk money you do not have
- Do not invest in non-productive assets like gold
- Do not envy people who make money from risky trades
Warren Buffett’s largest deals from 2001 to 2023
1. Burlington Northern Santa Fe Corp. - 44 billion USD
In 2009, Warren Buffett bought railway operator Burlington Northern Santa Fe Corp. for nearly 44 billion USD. According to the Guardian, in 2009, Burlington Northern Santa Fe Corp. railways stretched over approximately 32,000 route miles, and the company employed 40,000 people and ran 6,700 locomotives.
2. Precision Castparts Corp. - 37.2 billion USD
In 2015, the Oracle of Omaha acquired a majority stake in aerospace and energy equipment manufacturer Precision Castparts Corp. for 37.2 billion USD. In 2014, 70% of the company's revenue came from the aerospace industry, with clients including General Electric Co., Boeing Co., and Airbus Group SE.
3. H.J. Heinz Co. - 28 billion USD
In 2013, Warren Buffett together with 3G Capital purchased H.J. Heinz Co. food company for 28 billion USD. As reported by Reuters, H.J. Heinz Co.'s share in the global market was 26%, and its share in the US market was 59%.
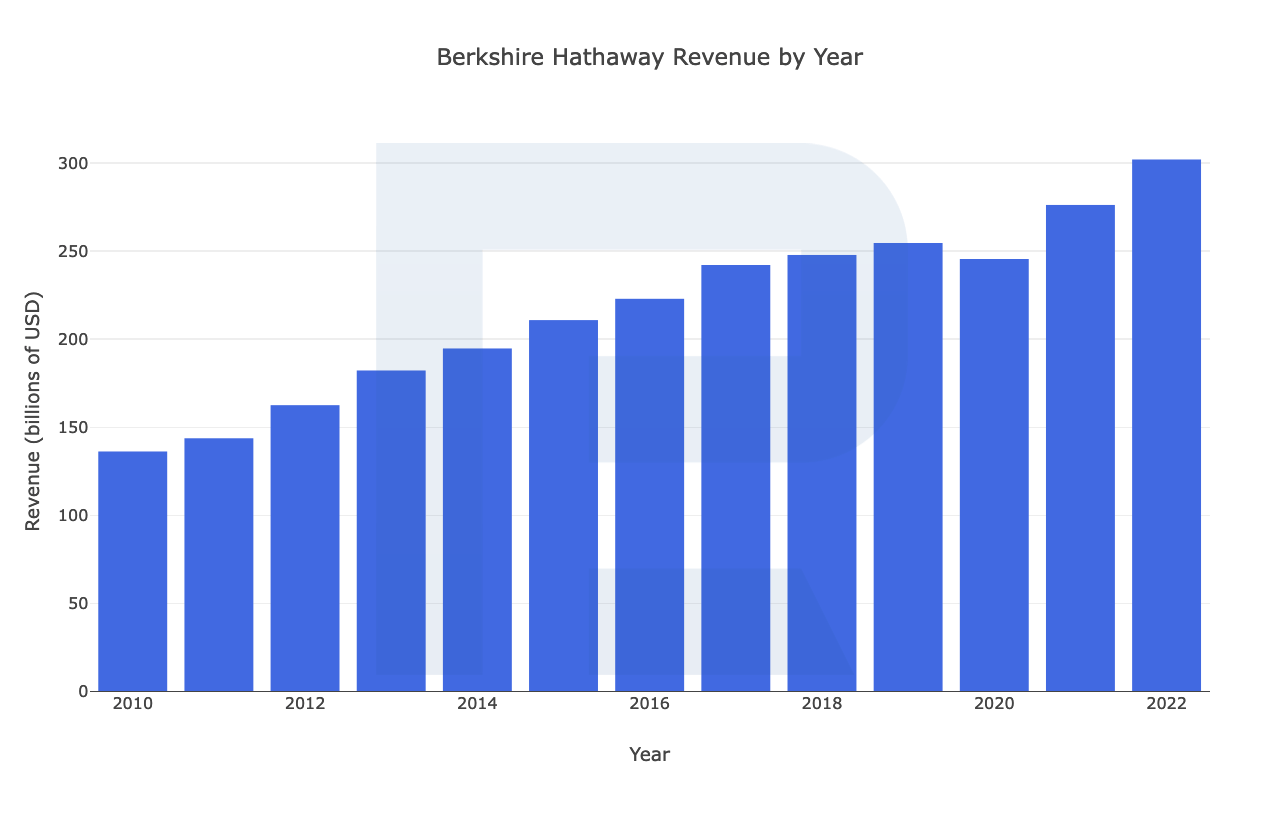
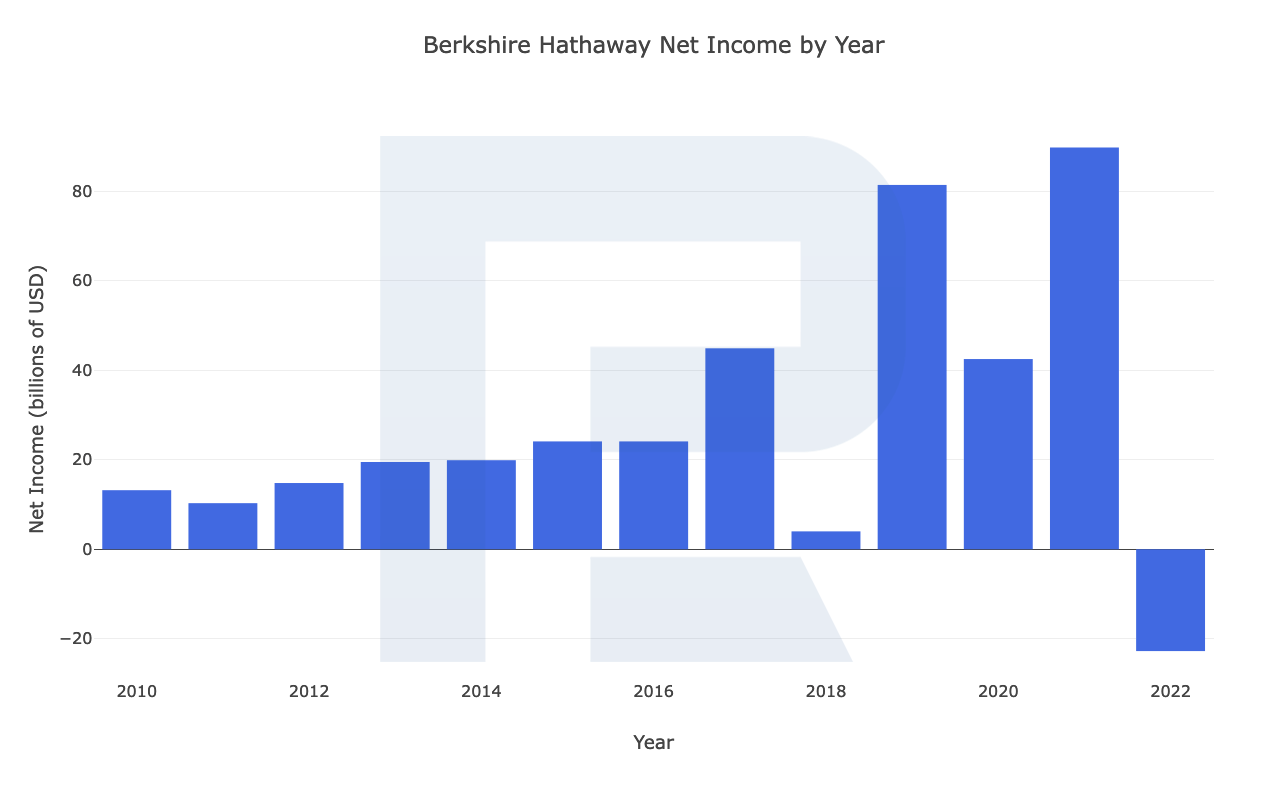
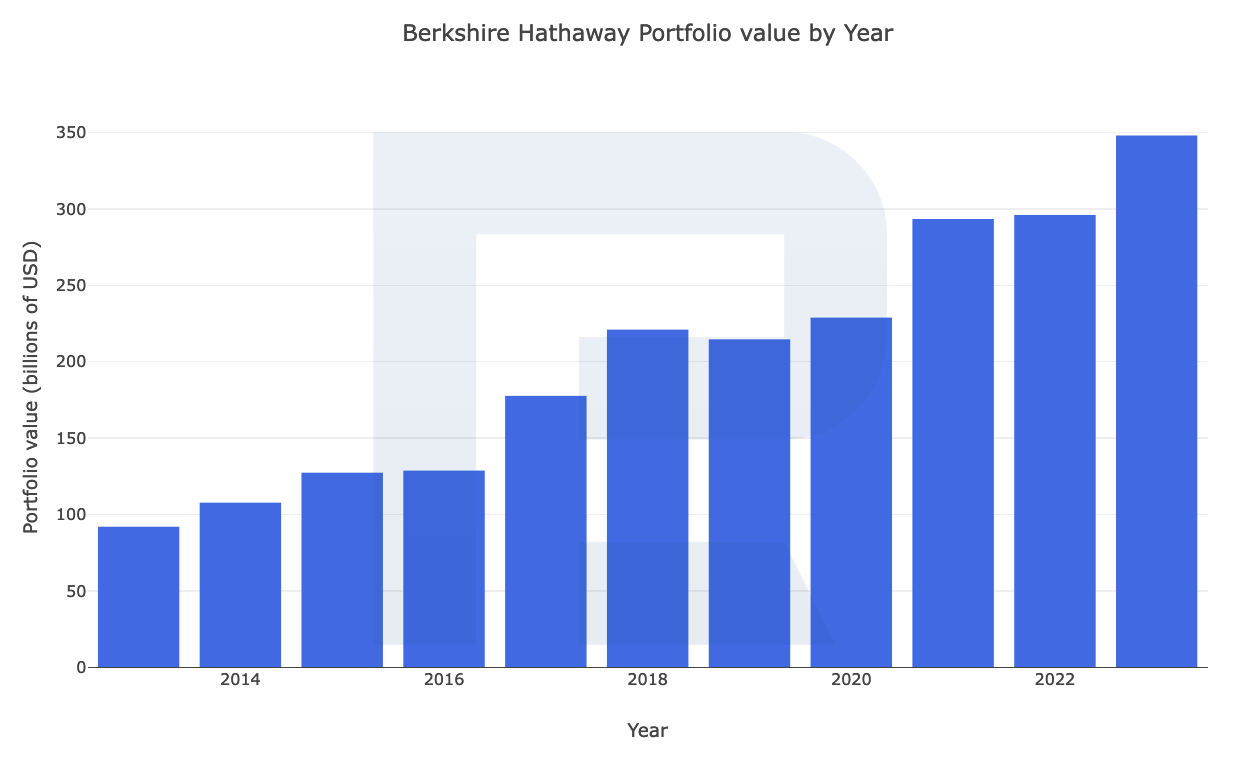
Berkshire Hathaway in brief
Founded in: 1955
Registered in: the US
Headquarters: Omaha, Nebraska
Market capitalisation: 763.92 billion USD
Buffett’s Top 3 stocks by investment volume for Q2 2023
According to Whale Wisdom data as at 30 June 2023, the top 3 stocks by investment volume for Berkshire Hathaway Inc. for Q2 2023 included Occidental Petroleum Corporation, D.R. Horton Inc., and Capital One Financial Corporation securities.
1. Occidental Petroleum Corporation - 0.73 billion USD
Founded in: 1920
Registered in: the US
Headquarters: Houston, Texas
Market capitalisation: 55.74 billion USD
Occidental Petroleum Corporation (NYSE: OXY) is a major oil and gas company specialising in crude oil and natural gas exploration, development, production, and sales.
From July to September 2023 inclusive, Berkshire Hathaway Inc. bought 12.42 million shares of Occidental Petroleum Corporation for 0.73 billion USD, at an average of 58 USD per unit. The share of this oil and gas stock in the investment portfolio of Buffett's fund reached 3.78%.
Based on Occidental Petroleum Corporation's Q2 2023 report, revenue decreased by 37.30% to 6.73 billion USD compared to the same period in 2022. Net profit fell 77.10%, dropping to 860 million USD, and EPS declined by 81.91%, to 0.68 USD.
Technical analysis of Occidental Petroleum stock
Since 11 August 2023, the quotes have been moving within the formation of the Head and Shoulders reversal pattern. A breakout of the pattern neckline with the price consolidating above the 68.00 USD level may indicate a possible completion of the pattern with a potential growth target of 74.00 USD.
Technical analysis of Occidental Petroleum November 9, 2023*
A rebound from the support line on the RSI may serve as an additional signal confirming a potential stock price rise. The price previously rebounded from the line on 23 June and 2 October 2023, following which the quotes were headed upwards.
A negative scenario for buyers could be a breakout of the support area with the price securing below 60.00 USD. This is likely to indicate that the reversal pattern might stop forming.
2. D.R. Horton Inc. - 0.73 billion USD
Founded in: 1978
Registered in: the US
Headquarters: Arlington, Texas
Market capitalisation: 40.21 billion USD
D.R. Horton Inc. (NYSE: DHI) is one of the largest residential property developers in the US. The company specialises in constructing private homes, apartments, and residential complexes in various regions in the US.
In Q2 2023, Buffett's fund purchased 5.97 million shares of D.R. Horton Inc. at an average price of 122 USD per unit. Total investments amounted to 0.73 billion USD with the stock weight in Berkshire Hathaway Inc.'s portfolio being 0.21%.
According to D.R. Horton Inc.'s Q3 fiscal 2023 report, revenue increased by 10.67% from the previous fiscal year, reaching 9.73 billion USD, while net profit fell 18.54% to 1.35 billion USD. EPS sank 16.38%, dropping to 3.93 USD.
Technical analysis of D.R. Horton stock
Having rebounded from the support area at 100.00 USD, D.R. Horton Inc. shares are experiencing aggressive growth of more than 17% at the time of writing. On 3 November 2023, the quotes left the descending channel, which might signal the end of a bearish correction.
Technical analysis of D.R. Horton Inc.*
Such developments create conditions for a potential price rise to the resistance level of 130.00 USD. A rebound from the upper boundary of the descending channel can additionally support the bullish scenario. A negative scenario for buyers could be a breakout of the support area, with the price gaining a foothold below 110.00 USD, potentially suggesting a possible price return to the bearish channel.
3. Capital One Financial Corp. - 0.28 billion USD
Founded in: 1988
Registered in: the US
Headquarters: McLean, Virginia
Market capitalisation: 40.49 billion USD
Capital One Financial Corp. (NYSE: COF) is one of the largest US banks. The company has developed several banking apps and was among the first to introduce digital and AI technology to the banking sector.
During Q2 2023, Berkshire Hathaway Inc. bought 2.55 million shares of Capital One Financial Corp., for a total of 0.28 billion USD, at an average price of 109 USD per unit. The US bank's stock weight in the fund's investment portfolio reached 0.39%.
Based on Capital One Financial Corp.' Q3 2023 report, revenue increased by 4.44% compared to the same period of the last year, reaching 9.4 billion USD, and net profit grew 5.88% to 1.8 billion USD or 4.55 USD per share.
Technical analysis of Capital One Financial stock
Capital One Financial Corp. quotes have been squeezed within the forming Triangle pattern since 3 February 2023, with the upper boundary at 117.50 USD and the lower at 87.00 USD. On 31 October 2023, the RSI values found a foothold above the descending trend line, which could signal a potential price rise to the upper boundary of the Triangle pattern.
Technical analysis of Capital One Financial Corp.*
If the quotes consolidate above the upper boundary of the descending corrective channel, in which they have been hovering since 2 June 2023, this could serve as an additional signal of a possible appreciation of the bank's stock.
A negative scenario for the bulls could be the price consolidating below the 90.00 USD level, which could indicate an exit from the Triangle pattern.
Top 3 largest holdings in Buffett’s portfolio
According to Whale Wisdom data as of 30 June 2023, the top 3 stocks with the largest holdings in Berkshire Hathaway Inc.'s investment portfolio are the securities of Apple Inc., Bank of America Corporation, and American Express Company.
1. Apple Inc. - 51%
Technical analysis of Apple Inc. stock
At the time of writing, Apple Inc. (NYSE: AAPL) shares attempted to break out of the Wedge reversal pattern. They have been squeezed within the forming pattern since 18 August 2023. A consolidation above the upper pattern boundary may suggest that the downward correction could end with the price continuing to rise.
Technical analysis of Apple Inc.*
Presumably, the nearest growth target for buyers could be the 200.00 USD level. The consolidation of the RSI values above the resistance level could serve as an additional signal in favour of a bullish scenario. A breakout of the support area with the price securing below 160.00 USD could be a negative scenario for buyers of the tech corporation stock. This could indicate that the price might break out of the long-term ascending channel.
2. Bank of America Corporation - 8.51%
Technical analysis of Bank of America Corporation stock
On 3 November 2023, Bank of America Corporation (NYSE: BAC) stock left the descending channel and consolidated above the upper boundary of the Double-Bottom reversal pattern. Presumably, the growth target as part of the development of the reversal pattern may be the level of 32.00 USD.
Technical analysis of Bank of America Corporation*
The bullish scenario could be additionally supported by the Head and Shoulders reversal pattern fully forming on the RSI. It is important for buyers to overcome strong resistance in the form of the 200-day Moving Average. This could suggest that an uptrend might resume.
A negative scenario for bulls could be a breakout of the support area with the price securing below 26.00 USD.
3. American Express Company - 7.59%
Technical analysis of American Express Company stock
American Express Company (NYSE: AXP) stock pushed off the support area of 140.00 USD on 30 October 2023. At the time of writing, the price approached the most significant resistance level, and if this is breached, the quotes could exit the corrective channel. Under such conditions, the growth target for buyers is likely to be the 180.00 USD level.
Technical analysis of American Express Company*
It can be presumed that a breakout of the descending trend line on the RSI could serve as an additional signal confirming a bullish scenario. A negative scenario for buyers might be a breakout of the support area with the price securing below 140.00 USD.
Conclusion
Warren Buffett remains an important figure in the financial world, with his investment decisions attracting the attention of many private investors. In Q2 2023, his Berkshire Hathaway Inc. fund's largest investments were in companies such as Occidental Petroleum Corporation, D.R. Horton Inc., and Capital One Financial Corp.
Buffett is cautious about adding new stocks to his portfolio, investing in economic sectors like construction, oil, and banking. However, stocks of the three major companies, Apple Inc., Bank of America Corporation, and American Express Company, still comprise a significant portion of his portfolio.
* – Past performance is not a reliable indicator of future results or future performance.
The material presented and the information contained herein is for information purposes only and in no way should be considered as the provision of investment advice for the purposes of Investment Firms Law 87(I)/2017 of the Republic of Cyprus or any other form of personal advice or recommendation, which relates to certain types of transactions with certain types of financial instruments.
The TradingView platform supplies the charts featured in this article, presenting a comprehensive suite of tools for examining financial markets. As a sophisticated online market data charting service, TradingView enables users to engage in technical analysis, explore financial data, and interact with fellow traders and investors. Additionally, this platform facilitates learning how to use a stock screener and provides insights into other financial assets.





 are complex instruments and come with a high
  of losing
  rapidly due to
  . 65.68% of retail investor accounts lose
  when trading
  with this provider. You should consider whether you understand how CFDs work and whether you can afford to take the high